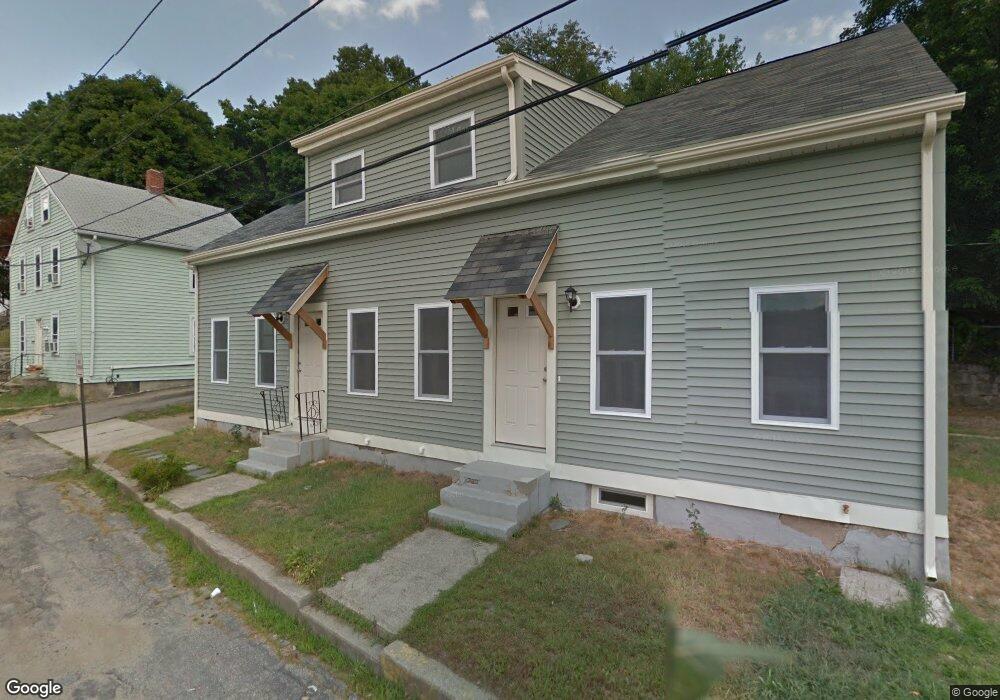
1 Sisson St West Warwick, RI 02893
Lippitt-Harris NeighborhoodEstimated Value: $470,000 - $537,000
6
Beds
2
Baths
2,484
Sq Ft
$201/Sq Ft
Est. Value
About This Home
This home is located at 1 Sisson St, West Warwick, RI 02893 and is currently estimated at $499,663, approximately $201 per square foot. 1 Sisson St is a home located in Kent County with nearby schools including West Warwick High School and St Joseph School.
Ownership History
Date
Name
Owned For
Owner Type
Purchase Details
Closed on
Nov 17, 2011
Sold by
House Of Hope Cmnty De
Bought by
Kentco Props Inc
Current Estimated Value
Purchase Details
Closed on
Dec 21, 2009
Sold by
Ri Hsng Dev Corp
Bought by
House Of Hope Comm Cor
Home Financials for this Owner
Home Financials are based on the most recent Mortgage that was taken out on this home.
Original Mortgage
$112,000
Interest Rate
5%
Mortgage Type
Purchase Money Mortgage
Purchase Details
Closed on
Jun 30, 2009
Sold by
Department Of Housing & Urban Dev
Bought by
Rhode Island Hsng Dev
Purchase Details
Closed on
Oct 10, 2008
Sold by
Rivas Jimmy
Bought by
Phh Mortgage Corp
Purchase Details
Closed on
Dec 19, 2001
Sold by
Pimental Maria O
Bought by
Rourke Eleanor
Create a Home Valuation Report for This Property
The Home Valuation Report is an in-depth analysis detailing your home's value as well as a comparison with similar homes in the area
Home Values in the Area
Average Home Value in this Area
Purchase History
| Date | Buyer | Sale Price | Title Company |
|---|---|---|---|
| Kentco Props Inc | -- | -- | |
| House Of Hope Comm Cor | $78,200 | -- | |
| Rhode Island Hsng Dev | $78,200 | -- | |
| Phh Mortgage Corp | $231,632 | -- | |
| Rourke Eleanor | $124,000 | -- |
Source: Public Records
Mortgage History
| Date | Status | Borrower | Loan Amount |
|---|---|---|---|
| Previous Owner | Rourke Eleanor | $112,000 | |
| Previous Owner | Rourke Eleanor | $78,200 |
Source: Public Records
Tax History
| Year | Tax Paid | Tax Assessment Tax Assessment Total Assessment is a certain percentage of the fair market value that is determined by local assessors to be the total taxable value of land and additions on the property. | Land | Improvement |
|---|---|---|---|---|
| 2025 | $6,121 | $400,300 | $67,900 | $332,400 |
| 2024 | $6,075 | $296,800 | $64,100 | $232,700 |
| 2023 | $5,957 | $296,800 | $64,100 | $232,700 |
| 2022 | $5,862 | $296,800 | $64,100 | $232,700 |
| 2021 | $6,098 | $204,000 | $49,000 | $155,000 |
| 2020 | $6,098 | $204,000 | $49,000 | $155,000 |
| 2019 | $5,981 | $204,000 | $49,000 | $155,000 |
| 2018 | $5,719 | $145,900 | $42,200 | $103,700 |
| 2017 | $5,537 | $145,900 | $42,200 | $103,700 |
| 2016 | $5,438 | $145,900 | $42,200 | $103,700 |
| 2015 | $3,738 | $144,000 | $42,200 | $101,800 |
| 2014 | $5,249 | $144,000 | $42,200 | $101,800 |
Source: Public Records
Map
Nearby Homes
Your Personal Tour Guide
Ask me questions while you tour the home.