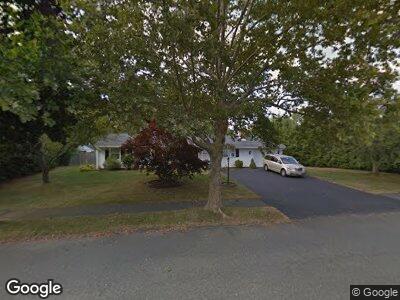
1 Sycamore Cir Peabody, MA 01960
West Peabody NeighborhoodEstimated Value: $633,905 - $680,000
3
Beds
1
Bath
1,296
Sq Ft
$508/Sq Ft
Est. Value
About This Home
This home is located at 1 Sycamore Cir, Peabody, MA 01960 and is currently estimated at $658,476, approximately $508 per square foot. 1 Sycamore Cir is a home located in Essex County with nearby schools including Peabody Veterans Memorial High School, Covenant Christian Academy, and Our Lady Of Assumption School.
Ownership History
Date
Name
Owned For
Owner Type
Purchase Details
Closed on
Jul 23, 2004
Sold by
Bettencourt Andrea J and Bettencourt Edward A
Bought by
Gardin Carl R
Current Estimated Value
Purchase Details
Closed on
Mar 11, 2003
Sold by
Finnegan Douglas R and Finnegan Nancy C
Bought by
Bettencourt Edward A
Purchase Details
Closed on
Jul 22, 1993
Sold by
Folsom Robert W and Folsom Jacqueline
Bought by
Finnegan Douglas and Finnegan Nancy
Create a Home Valuation Report for This Property
The Home Valuation Report is an in-depth analysis detailing your home's value as well as a comparison with similar homes in the area
Home Values in the Area
Average Home Value in this Area
Purchase History
| Date | Buyer | Sale Price | Title Company |
|---|---|---|---|
| Gardin Carl R | $426,000 | -- | |
| Bettencourt Edward A | $370,000 | -- | |
| Finnegan Douglas | $162,000 | -- |
Source: Public Records
Mortgage History
| Date | Status | Borrower | Loan Amount |
|---|---|---|---|
| Open | Gardin Carl R | $285,000 | |
| Closed | Gardin Carl R | $281,500 | |
| Closed | Folsom Robert W | $44,000 | |
| Closed | Folsom Robert W | $35,000 |
Source: Public Records
Tax History Compared to Growth
Tax History
| Year | Tax Paid | Tax Assessment Tax Assessment Total Assessment is a certain percentage of the fair market value that is determined by local assessors to be the total taxable value of land and additions on the property. | Land | Improvement |
|---|---|---|---|---|
| 2025 | $5,290 | $571,300 | $322,200 | $249,100 |
| 2024 | $5,104 | $559,700 | $322,200 | $237,500 |
| 2023 | $5,052 | $530,700 | $268,500 | $262,200 |
| 2022 | $4,914 | $486,500 | $233,500 | $253,000 |
| 2021 | $4,581 | $436,700 | $212,300 | $224,400 |
| 2020 | $4,648 | $432,800 | $212,300 | $220,500 |
| 2019 | $4,412 | $400,700 | $212,300 | $188,400 |
| 2018 | $4,088 | $356,700 | $189,500 | $167,200 |
| 2017 | $4,062 | $345,400 | $189,500 | $155,900 |
| 2016 | $3,847 | $322,700 | $189,500 | $133,200 |
| 2015 | $3,895 | $316,700 | $189,500 | $127,200 |
Source: Public Records
Map
Nearby Homes