
Seller's Agent in 2026
Dawn Krause
Keller Williams Chesterfield
(314) 936-3182
24 in this area
660 Total Sales
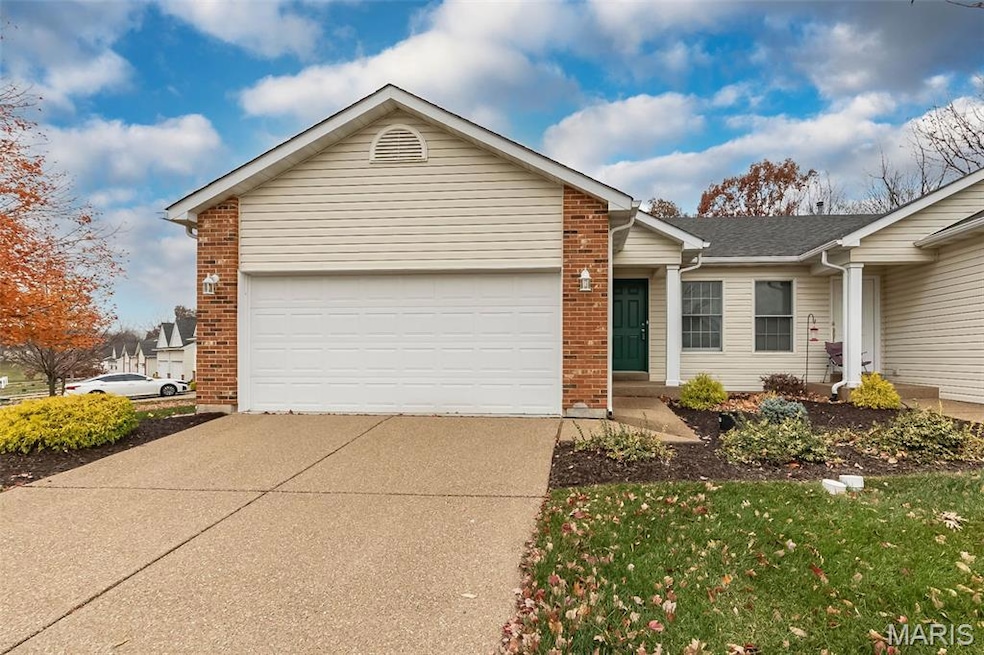


Welcome to easy, low-maintenance living in this light-filled 2 bed, 2 bath villa with an inviting open floor plan! Vaulted ceilings, skylights, and a wall of windows set the tone the moment you step inside, creating a bright and airy great room perfect for everyday living and effortless entertaining. The kitchen offers plenty of cabinet space and a seamless connection to the dining and living areas—ideal for hosting, cooking, or just staying part of the conversation. Both bedrooms are generously sized, including a comfortable primary suite with a spacious bath. The walkout lower level is unfinished with a bath rough-in, giving you a true blank canvas to add a third bedroom, rec room, home office, or workshop—whatever fits your lifestyle. Outside, unwind on the deck overlooking a private, wooded backdrop that feels miles from the hustle but still close to everything. A two-car garage, main floor laundry, and low monthly HOA fees round out this wonderful opportunity. Come see why this villa is the perfect mix of comfort, convenience, and potential!
Last Agent to Sell the Property
Keller Williams Chesterfield License #2001030412 Listed on: 11/19/2025
| Date | Type | Sale Price | Title Company |
|---|---|---|---|
| Warranty Deed | -- | Title Partners | |
| Interfamily Deed Transfer | -- | None Available | |
| Special Warranty Deed | $105,000 | Sec | |
| Special Warranty Deed | -- | Continental Title Company | |
| Trustee Deed | $154,304 | None Available | |
| Special Warranty Deed | -- | -- |
| Date | Status | Loan Amount | Loan Type |
|---|---|---|---|
| Open | $286,020 | VA | |
| Previous Owner | $139,695 | FHA |
| Date | Event | Price | List to Sale | Price per Sq Ft |
|---|---|---|---|---|
| 01/30/2026 01/30/26 | Sold | -- | -- | -- |
| 01/09/2026 01/09/26 | Pending | -- | -- | -- |
| 11/19/2025 11/19/25 | For Sale | $280,000 | -- | $232 / Sq Ft |
| Year | Tax Paid | Tax Assessment Tax Assessment Total Assessment is a certain percentage of the fair market value that is determined by local assessors to be the total taxable value of land and additions on the property. | Land | Improvement |
|---|---|---|---|---|
| 2025 | $2,870 | $46,269 | -- | -- |
| 2023 | $2,871 | $43,213 | $0 | $0 |
| 2022 | $2,481 | $34,683 | $0 | $0 |
| 2021 | $2,483 | $34,683 | $0 | $0 |
| 2020 | $2,289 | $31,004 | $0 | $0 |
| 2019 | $2,295 | $31,004 | $0 | $0 |
| 2018 | $2,179 | $28,106 | $0 | $0 |
| 2017 | $2,145 | $28,106 | $0 | $0 |
| 2016 | $1,856 | $24,213 | $0 | $0 |
| 2015 | $1,726 | $24,213 | $0 | $0 |
| 2014 | $1,861 | $25,699 | $0 | $0 |
Seller's Agent in 2026
Dawn Krause
Keller Williams Chesterfield
(314) 936-3182
24 in this area
660 Total Sales
N
Buyer's Agent in 2026
Neiman Martin
ReeceNichols Real Estate
(314) 478-3321
1 in this area
3 Total Sales
Source: MARIS MLS
MLS Number: MIS25076487
APN: 2-0042-8535-00-065A.0000000
Disclaimer: Certain information contained herein is derived from information provided by parties other than Homes.com. All information provided is deemed reliable, but is not guaranteed to be accurate and should be independently verified.
![]() Based on information submitted to the MLS GRID. All data is obtained from various sources and may not have been verified by broker or MLS GRID. Supplied Open House Information is subject to change without notice. All information should be independently reviewed and verified for accuracy. Properties may or may not be listed by the office/agent presenting the information. Some IDX listings have been excluded from this website.
Based on information submitted to the MLS GRID. All data is obtained from various sources and may not have been verified by broker or MLS GRID. Supplied Open House Information is subject to change without notice. All information should be independently reviewed and verified for accuracy. Properties may or may not be listed by the office/agent presenting the information. Some IDX listings have been excluded from this website.
Based on information submitted to the MLS GRID
Ask me questions while you tour the home.