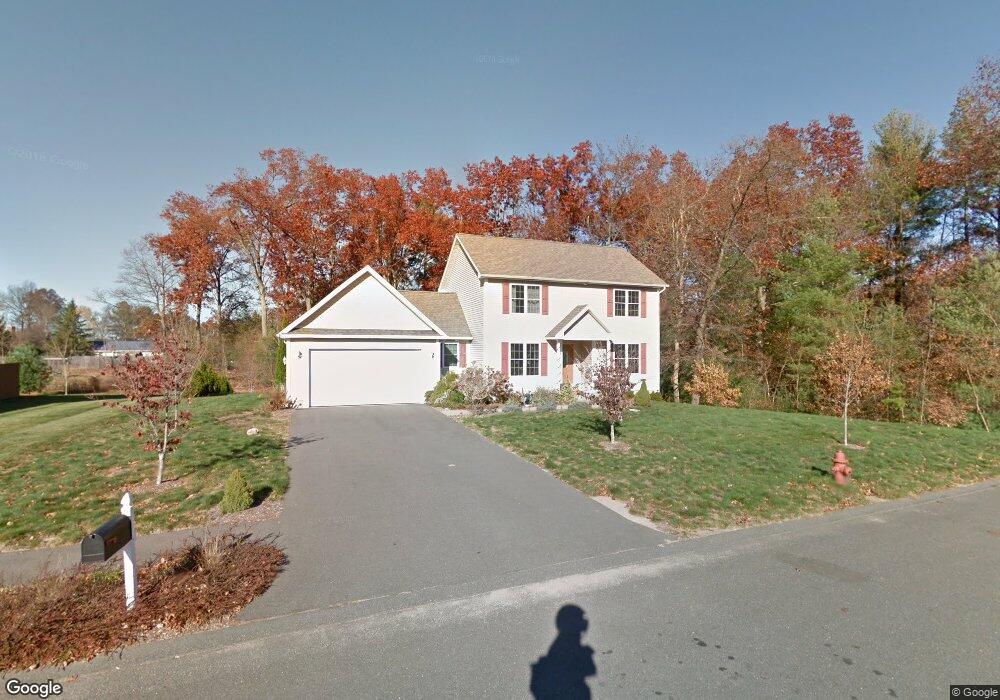
1 Willow Cir Easthampton, MA 01027
Estimated Value: $566,682 - $607,000
3
Beds
3
Baths
1,631
Sq Ft
$362/Sq Ft
Est. Value
About This Home
This home is located at 1 Willow Cir, Easthampton, MA 01027 and is currently estimated at $590,171, approximately $361 per square foot. 1 Willow Cir is a home located in Hampshire County with nearby schools including Easthampton High School, Calvary Baptist Christian School, and Tri-County Schools.
Ownership History
Date
Name
Owned For
Owner Type
Purchase Details
Closed on
Apr 13, 2007
Sold by
Czelusniak Custom Hom
Bought by
Bixby Cynthia M and Bixby Keith T
Current Estimated Value
Home Financials for this Owner
Home Financials are based on the most recent Mortgage that was taken out on this home.
Original Mortgage
$271,200
Outstanding Balance
$164,785
Interest Rate
6.24%
Mortgage Type
Purchase Money Mortgage
Estimated Equity
$425,386
Create a Home Valuation Report for This Property
The Home Valuation Report is an in-depth analysis detailing your home's value as well as a comparison with similar homes in the area
Home Values in the Area
Average Home Value in this Area
Purchase History
| Date | Buyer | Sale Price | Title Company |
|---|---|---|---|
| Bixby Cynthia M | $339,000 | -- |
Source: Public Records
Mortgage History
| Date | Status | Borrower | Loan Amount |
|---|---|---|---|
| Open | Bixby Cynthia M | $271,200 |
Source: Public Records
Tax History Compared to Growth
Tax History
| Year | Tax Paid | Tax Assessment Tax Assessment Total Assessment is a certain percentage of the fair market value that is determined by local assessors to be the total taxable value of land and additions on the property. | Land | Improvement |
|---|---|---|---|---|
| 2025 | $6,856 | $501,500 | $131,600 | $369,900 |
| 2024 | $6,617 | $488,000 | $127,900 | $360,100 |
| 2023 | $4,905 | $334,800 | $100,700 | $234,100 |
| 2022 | $5,534 | $334,800 | $100,700 | $234,100 |
| 2021 | $6,090 | $347,200 | $100,700 | $246,500 |
| 2020 | $5,946 | $334,800 | $100,700 | $234,100 |
| 2019 | $5,345 | $345,700 | $117,400 | $228,300 |
| 2018 | $5,147 | $321,700 | $110,800 | $210,900 |
| 2017 | $5,023 | $309,900 | $106,500 | $203,400 |
| 2016 | $4,831 | $309,900 | $106,500 | $203,400 |
| 2015 | $4,695 | $309,900 | $106,500 | $203,400 |
Source: Public Records
Map
Nearby Homes