
Seller's Agent in 2025
Alice Frawley
Navigators Real Estate
(805) 471-0312
6 in this area
39 Total Sales
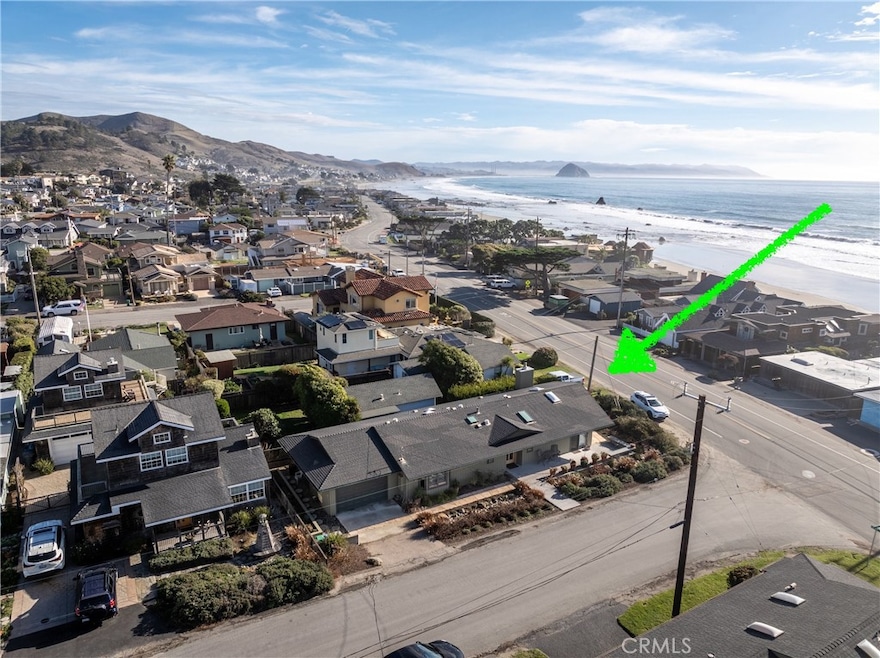
Located on the corner of Pacific & 11th just steps from the sand and surf, this meticulously remodeled single level home showcases quality craftsmanship and timeless design. This home was taken down to the studs and every detail was carefully considered to enhance both style and functionality. Bamboo and natural stone flooring, on demand water heater, water softener and radiant heat are just a few of the upgraded amenities. The welcoming entryway leads into the open living space, where sunlight beams through numerous skylights and large windows. The vaulted ceiling, built in cabinetry and cozy fireplace set the tone for relaxation. The stunning kitchen is a chef’s delight, featuring soft-close cabinetry, striking green concrete countertops, under-cabinet lighting, a reverse osmosis system, and a pantry with automatic lighting. For those who love books or need a dedicated workspace, the office/library is a highlight with its floor-to-ceiling built-in bookshelves. A separate laundry room provides extra convenience, complete with a utility sink and additional storage. The spacious primary suite is a private retreat, offering dual sinks, a steam shower, a kickspace heater, and a walk-in closet. The versatile guest room is designed for flexibility, featuring a beautifully crafted Murphy bed wall—perfect for hosting guests or transforming into a yoga studio or meditation space. The garage adds even more functionality, equipped with quality cabinetry and a convenient surfer’s shower—ideal for rinsing off after a day at the beach. Located just moments from two beach access points, this exceptional home is perfect for full-time living or a luxurious getaway.
Last Agent to Sell the Property
Navigators Real Estate Brokerage Phone: 805-471-0312 License #00818334 Listed on: 10/27/2025
| Date | Type | Sale Price | Title Company |
|---|---|---|---|
| Grant Deed | $1,975,000 | Chicago Title Company | |
| Interfamily Deed Transfer | -- | Cuesta Title Company | |
| Interfamily Deed Transfer | -- | Cuesta Title Company | |
| Interfamily Deed Transfer | -- | -- | |
| Grant Deed | $483,000 | Chicago Title Co |
| Date | Status | Loan Amount | Loan Type |
|---|---|---|---|
| Previous Owner | $322,700 | Purchase Money Mortgage | |
| Previous Owner | $386,400 | No Value Available |
| Date | Event | Price | List to Sale | Price per Sq Ft |
|---|---|---|---|---|
| 12/01/2025 12/01/25 | Sold | $1,975,000 | 0.0% | $1,225 / Sq Ft |
| 10/27/2025 10/27/25 | For Sale | $1,975,000 | -- | $1,225 / Sq Ft |
| Year | Tax Paid | Tax Assessment Tax Assessment Total Assessment is a certain percentage of the fair market value that is determined by local assessors to be the total taxable value of land and additions on the property. | Land | Improvement |
|---|---|---|---|---|
| 2025 | $7,827 | $757,183 | $548,691 | $208,492 |
| 2024 | $7,740 | $742,337 | $537,933 | $204,404 |
| 2023 | $7,740 | $727,783 | $527,386 | $200,397 |
| 2022 | $7,608 | $713,514 | $517,046 | $196,468 |
| 2021 | $7,499 | $699,524 | $506,908 | $192,616 |
| 2020 | $7,419 | $692,352 | $501,711 | $190,641 |
| 2019 | $7,272 | $678,777 | $491,874 | $186,903 |
| 2018 | $7,127 | $665,469 | $482,230 | $183,239 |
| 2017 | $6,984 | $652,422 | $472,775 | $179,647 |
| 2016 | $6,845 | $639,630 | $463,505 | $176,125 |
| 2015 | $6,785 | $630,023 | $456,543 | $173,480 |
| 2014 | $6,545 | $617,682 | $447,600 | $170,082 |
Seller's Agent in 2025
Alice Frawley
Navigators Real Estate
(805) 471-0312
6 in this area
39 Total Sales
Buyer's Agent in 2025
Dale Kaiser
Dale Kaiser Real Estate
(805) 995-2900
100 in this area
141 Total Sales
Source: California Regional Multiple Listing Service (CRMLS)
MLS Number: SC25246547
APN: 064-221-009
Disclaimer: Certain information contained herein is derived from information provided by parties other than Homes.com. All information provided is deemed reliable, but is not guaranteed to be accurate and should be independently verified.
![]() The multiple listing data appearing on this website, or contained in reports produced therefrom, is owned and copyrighted by California Regional Multiple Listing Service, Inc. ("CRMLS") and is protected by all applicable copyright laws. Information provided is for viewer's personal, non-commercial use and may not be used for any purpose other than to identify prospective properties the viewer may be interested in purchasing. All listing data, including but not limited to square footage and lot size is believed to be accurate, but the listing Agent, listing Broker and CRMLS and its affiliates do not warrant or guarantee such accuracy. The viewer should independently verify the listed data prior to making any decisions based on such information by personal inspection and/or contacting a real estate professional.
The multiple listing data appearing on this website, or contained in reports produced therefrom, is owned and copyrighted by California Regional Multiple Listing Service, Inc. ("CRMLS") and is protected by all applicable copyright laws. Information provided is for viewer's personal, non-commercial use and may not be used for any purpose other than to identify prospective properties the viewer may be interested in purchasing. All listing data, including but not limited to square footage and lot size is believed to be accurate, but the listing Agent, listing Broker and CRMLS and its affiliates do not warrant or guarantee such accuracy. The viewer should independently verify the listed data prior to making any decisions based on such information by personal inspection and/or contacting a real estate professional.
Based on information from California Regional Multiple Listing Service, Inc. and /or other sources. All data, including all measurements and calculations of area, is obtained from various sources and has not been, and will not be, verified by broker or MLS. All information should be independently reviewed and verified for accuracy. Properties may or may not be listed by the office/agent presenting the information
Ask me questions while you tour the home.