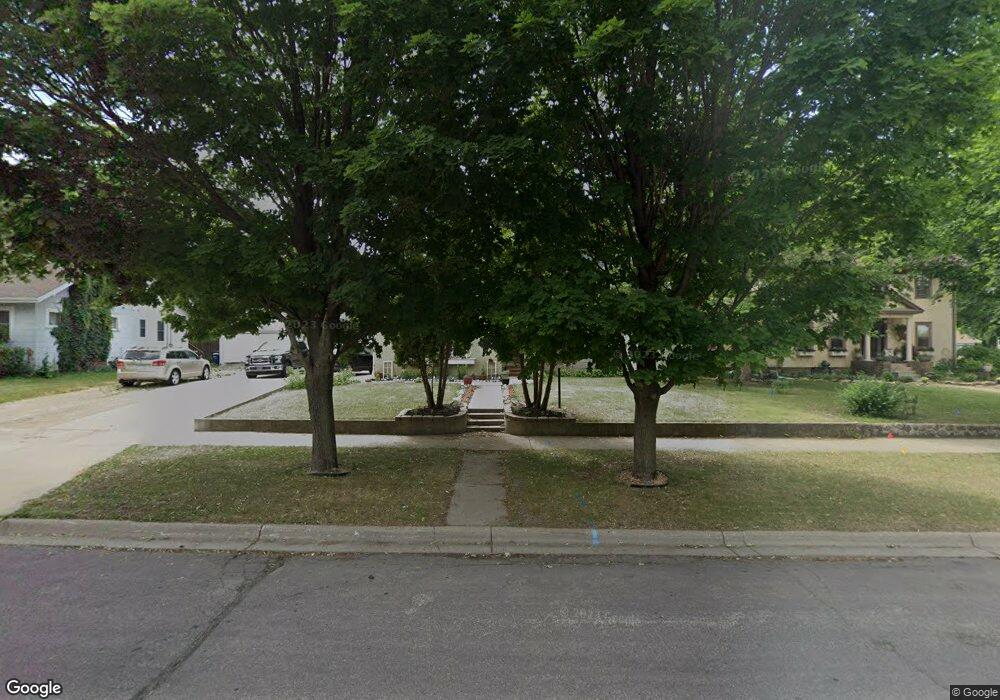
10 2nd Ave NW Faribault, MN 55021
Estimated Value: $296,000 - $374,000
4
Beds
4
Baths
2,155
Sq Ft
$148/Sq Ft
Est. Value
About This Home
This home is located at 10 2nd Ave NW, Faribault, MN 55021 and is currently estimated at $318,717, approximately $147 per square foot. 10 2nd Ave NW is a home located in Rice County with nearby schools including Roosevelt Elementary School, Faribault Middle School, and Faribault Senior High School.
Ownership History
Date
Name
Owned For
Owner Type
Purchase Details
Closed on
Aug 17, 2023
Sold by
Collins Jason Edward
Bought by
Collins Danetta Lee and Collins Jason Edward
Current Estimated Value
Purchase Details
Closed on
Oct 26, 2017
Sold by
Johnson Jeffrey M and Johnson Angela Kroening
Bought by
Collins Jason
Home Financials for this Owner
Home Financials are based on the most recent Mortgage that was taken out on this home.
Original Mortgage
$220,825
Interest Rate
4.37%
Mortgage Type
FHA
Create a Home Valuation Report for This Property
The Home Valuation Report is an in-depth analysis detailing your home's value as well as a comparison with similar homes in the area
Home Values in the Area
Average Home Value in this Area
Purchase History
| Date | Buyer | Sale Price | Title Company |
|---|---|---|---|
| Collins Danetta Lee | $500 | None Listed On Document | |
| Collins Jason | $224,900 | Burnet Title |
Source: Public Records
Mortgage History
| Date | Status | Borrower | Loan Amount |
|---|---|---|---|
| Previous Owner | Collins Jason | $220,825 |
Source: Public Records
Tax History Compared to Growth
Tax History
| Year | Tax Paid | Tax Assessment Tax Assessment Total Assessment is a certain percentage of the fair market value that is determined by local assessors to be the total taxable value of land and additions on the property. | Land | Improvement |
|---|---|---|---|---|
| 2025 | $3,276 | $299,100 | $52,600 | $246,500 |
| 2024 | $3,276 | $296,500 | $49,400 | $247,100 |
| 2023 | $3,280 | $296,500 | $49,400 | $247,100 |
| 2022 | $2,972 | $278,700 | $49,400 | $229,300 |
| 2021 | $2,860 | $239,900 | $39,800 | $200,100 |
| 2020 | $2,708 | $230,800 | $38,300 | $192,500 |
| 2019 | $2,492 | $223,600 | $38,300 | $185,300 |
| 2018 | $1,876 | $205,500 | $35,100 | $170,400 |
| 2017 | $1,798 | $158,000 | $31,900 | $126,100 |
| 2016 | $1,750 | $148,600 | $31,900 | $116,700 |
| 2015 | $1,680 | $142,600 | $25,500 | $117,100 |
| 2014 | -- | $143,400 | $31,900 | $111,500 |
Source: Public Records
Map
Nearby Homes