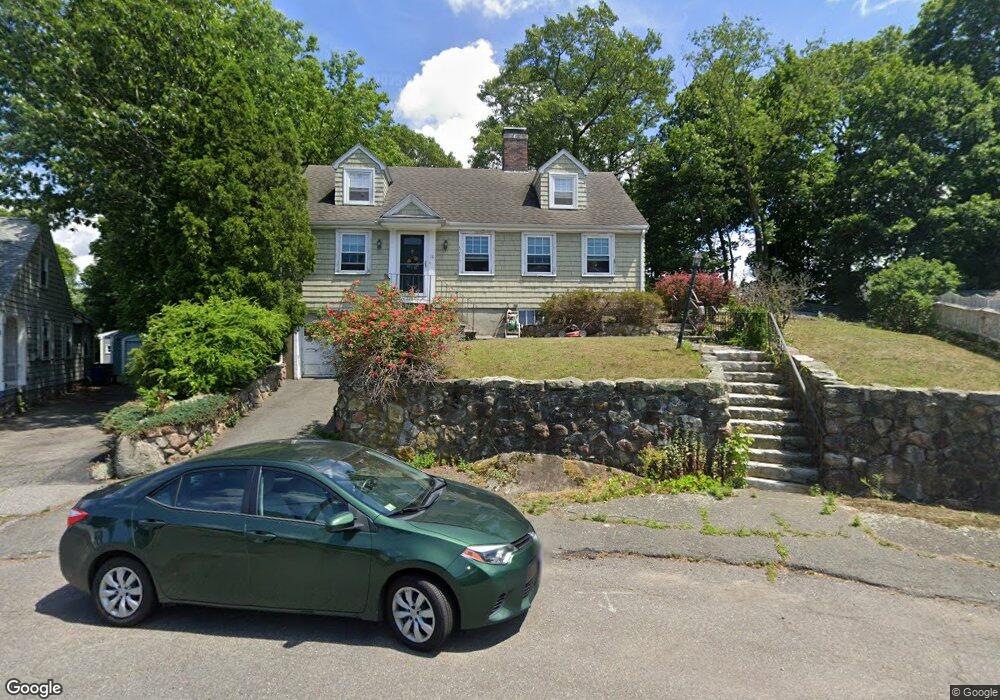
10 Bayfield Rd Saugus, MA 01906
Pleasant Hills NeighborhoodEstimated Value: $645,741 - $734,000
4
Beds
2
Baths
1,806
Sq Ft
$379/Sq Ft
Est. Value
About This Home
This home is located at 10 Bayfield Rd, Saugus, MA 01906 and is currently estimated at $684,935, approximately $379 per square foot. 10 Bayfield Rd is a home located in Essex County with nearby schools including Saugus High School, Pioneer Charter School Of Science II, and Melrose Montessori School.
Ownership History
Date
Name
Owned For
Owner Type
Purchase Details
Closed on
Apr 27, 2007
Sold by
Byrne Patricia M
Bought by
Murphy Michael J and Diperna Sandra J
Current Estimated Value
Home Financials for this Owner
Home Financials are based on the most recent Mortgage that was taken out on this home.
Original Mortgage
$247,920
Interest Rate
6.18%
Mortgage Type
Purchase Money Mortgage
Purchase Details
Closed on
Feb 25, 2005
Sold by
Byrne Patricia M
Bought by
Byrne Patricia M
Purchase Details
Closed on
May 24, 1991
Sold by
Heller Leslie D
Bought by
Byrne John J
Home Financials for this Owner
Home Financials are based on the most recent Mortgage that was taken out on this home.
Original Mortgage
$153,900
Interest Rate
9.36%
Mortgage Type
Purchase Money Mortgage
Create a Home Valuation Report for This Property
The Home Valuation Report is an in-depth analysis detailing your home's value as well as a comparison with similar homes in the area
Home Values in the Area
Average Home Value in this Area
Purchase History
| Date | Buyer | Sale Price | Title Company |
|---|---|---|---|
| Murphy Michael J | $309,900 | -- | |
| Byrne Patricia M | -- | -- | |
| Byrne John J | $162,000 | -- |
Source: Public Records
Mortgage History
| Date | Status | Borrower | Loan Amount |
|---|---|---|---|
| Open | Byrne John J | $235,200 | |
| Closed | Byrne John J | $247,920 | |
| Previous Owner | Byrne John J | $148,400 | |
| Previous Owner | Byrne John J | $153,900 |
Source: Public Records
Tax History Compared to Growth
Tax History
| Year | Tax Paid | Tax Assessment Tax Assessment Total Assessment is a certain percentage of the fair market value that is determined by local assessors to be the total taxable value of land and additions on the property. | Land | Improvement |
|---|---|---|---|---|
| 2025 | $5,915 | $553,800 | $324,300 | $229,500 |
| 2024 | $5,719 | $537,000 | $315,500 | $221,500 |
| 2023 | $5,490 | $487,600 | $276,100 | $211,500 |
| 2022 | $5,424 | $451,600 | $256,800 | $194,800 |
| 2021 | $4,947 | $400,900 | $213,000 | $187,900 |
| 2020 | $4,654 | $390,400 | $202,500 | $187,900 |
| 2019 | $4,570 | $375,200 | $192,800 | $182,400 |
| 2018 | $4,084 | $352,700 | $184,100 | $168,600 |
| 2017 | $3,864 | $320,700 | $175,300 | $145,400 |
| 2016 | $3,472 | $284,600 | $166,500 | $118,100 |
| 2015 | $3,259 | $271,100 | $158,600 | $112,500 |
| 2014 | $3,248 | $279,800 | $158,600 | $121,200 |
Source: Public Records
Map
Nearby Homes