10 Blue Jacket Way Brewster, MA 02631
Estimated Value: $1,152,000 - $1,690,000
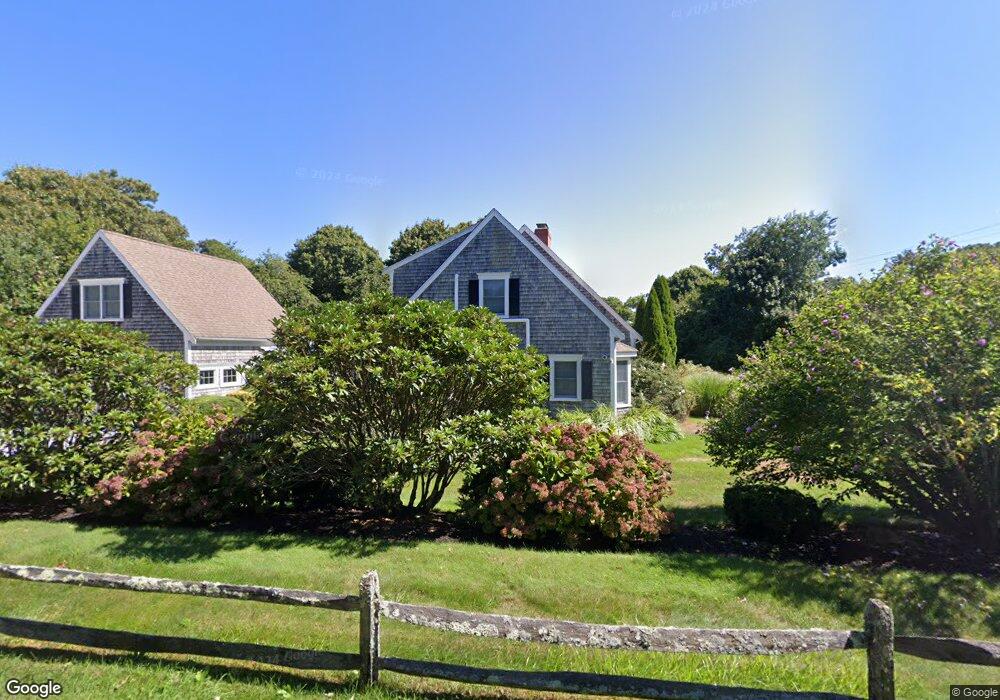
About This Home
This home is located at 10 Blue Jacket Way, Brewster, MA 02631 and is currently estimated at $1,301,517, approximately $542 per square foot. 10 Blue Jacket Way is a home located in Barnstable County with nearby schools including Stony Brook Elementary School, Eddy Elementary School, and Nauset Regional Middle School.
Ownership History
We collect this data history from publicly available records. To have your information removed, we recommend requesting removal directly through your county’s website.
Purchase Details
Home Financials for this Owner
Home Financials are based on the most recent Mortgage that was taken out on this home.Purchase Details
Home Financials for this Owner
Home Financials are based on the most recent Mortgage that was taken out on this home.Home Values in the Area
Average Home Value in this Area
Purchase History
We collect this data history from publicly available records. To have your information removed, we recommend requesting removal directly through your county’s website.
| Date | Buyer | Sale Price | Title Company |
|---|---|---|---|
| $625,000 | -- | ||
| $625,000 | -- | ||
| -- | -- | ||
| -- | -- |
Mortgage History
We collect this data history from publicly available records. To have your information removed, we recommend requesting removal directly through your county’s website.
| Date | Status | Borrower | Loan Amount |
|---|---|---|---|
| Open | $350,000 | ||
| Closed | $350,000 | ||
| Previous Owner | $400,000 |
Tax History
We collect this data history from publicly available records. To have your information removed, we recommend requesting removal directly through your county’s website.
| Year | Tax Paid | Tax Assessment Tax Assessment Total Assessment is a certain percentage of the fair market value that is determined by local assessors to be the total taxable value of land and additions on the property. | Land | Improvement |
|---|---|---|---|---|
| 2025 | $7,117 | $1,034,400 | $280,800 | $753,600 |
| 2024 | $6,650 | $976,500 | $264,900 | $711,600 |
| 2023 | $6,154 | $880,400 | $236,500 | $643,900 |
| 2022 | $5,774 | $735,600 | $197,000 | $538,600 |
| 2021 | $5,548 | $646,600 | $171,300 | $475,300 |
| 2020 | $5,381 | $624,200 | $171,300 | $452,900 |
| 2019 | $3,800 | $608,200 | $164,700 | $443,500 |
| 2018 | $4,927 | $596,500 | $164,700 | $431,800 |
| 2017 | $4,816 | $574,000 | $164,700 | $409,300 |
| 2016 | $4,595 | $545,100 | $161,500 | $383,600 |
| 2015 | $4,436 | $537,000 | $158,300 | $378,700 |
Map
- 0 Ridgewood Dr
- 80 Abby Rd
- 215 Stony Brook Rd
- 0 Canoe Pond Dr
- 98 Leland Rd
- 20 Spring Ln
- 62 Bridle Path Rd
- 92 Whiffletree Ave
- 130 Spring Ln
- 232 Robbins Hill Rd
- 49 Quivet Dr
- 309 Great Fields Rd
- 108 Wintergreen Ln
- 46 Monument View Rd
- 46 Monument View Rd
- 32 Indian Field Dr
- 83 Airline Rd
- 1580 Main St
- 56 Shad Bush Cir
- 43 Palmer Ln
Ask me questions while you tour the home.