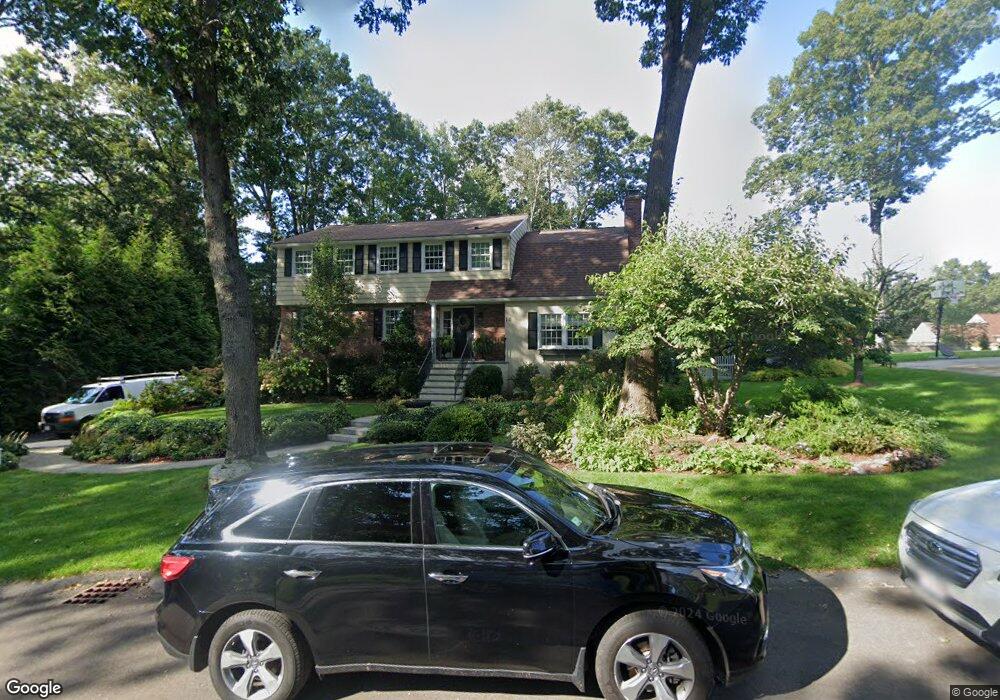
10 Bradley Rd Andover, MA 01810
Ballardvale NeighborhoodEstimated Value: $1,169,642 - $1,457,000
4
Beds
4
Baths
3,358
Sq Ft
$395/Sq Ft
Est. Value
About This Home
This home is located at 10 Bradley Rd, Andover, MA 01810 and is currently estimated at $1,325,911, approximately $394 per square foot. 10 Bradley Rd is a home located in Essex County with nearby schools including South Elementary School, Andover West Middle School, and Andover High School.
Ownership History
Date
Name
Owned For
Owner Type
Purchase Details
Closed on
May 15, 2025
Sold by
Williams Lisa S and Williams John C
Bought by
Williams Ft and Williams
Current Estimated Value
Purchase Details
Closed on
Sep 2, 2021
Sold by
Clarkson-Williams John and Williams Lisa S
Bought by
10 Bradley Road Rt and Williams
Purchase Details
Closed on
May 12, 1995
Sold by
Anthony Stephen C
Bought by
Williams John Clarkson
Purchase Details
Closed on
Dec 18, 1992
Sold by
Currier David C
Bought by
Anthony Stephen C
Create a Home Valuation Report for This Property
The Home Valuation Report is an in-depth analysis detailing your home's value as well as a comparison with similar homes in the area
Home Values in the Area
Average Home Value in this Area
Purchase History
| Date | Buyer | Sale Price | Title Company |
|---|---|---|---|
| Williams Ft | -- | None Available | |
| Williams Ft | -- | None Available | |
| Williams John C | -- | None Available | |
| Williams John C | -- | None Available | |
| 10 Bradley Road Rt | -- | None Available | |
| 10 Bradley Road Rt | -- | None Available | |
| 10 Bradley Road Rt | -- | None Available | |
| Williams John Clarkson | $239,460 | -- | |
| Williams John Clarkson | $239,460 | -- | |
| Anthony Stephen C | $238,000 | -- | |
| Anthony Stephen C | $238,000 | -- |
Source: Public Records
Mortgage History
| Date | Status | Borrower | Loan Amount |
|---|---|---|---|
| Previous Owner | Anthony Stephen C | $228,721 | |
| Previous Owner | Anthony Stephen C | $100,000 |
Source: Public Records
Tax History
| Year | Tax Paid | Tax Assessment Tax Assessment Total Assessment is a certain percentage of the fair market value that is determined by local assessors to be the total taxable value of land and additions on the property. | Land | Improvement |
|---|---|---|---|---|
| 2024 | $11,843 | $919,500 | $474,600 | $444,900 |
| 2023 | $11,331 | $829,500 | $427,500 | $402,000 |
| 2022 | $10,646 | $729,200 | $371,800 | $357,400 |
| 2021 | $10,192 | $666,600 | $338,000 | $328,600 |
| 2020 | $9,812 | $653,700 | $329,900 | $323,800 |
| 2019 | $9,376 | $614,000 | $301,400 | $312,600 |
| 2018 | $9,062 | $579,400 | $289,800 | $289,600 |
| 2017 | $8,701 | $573,200 | $284,200 | $289,000 |
| 2016 | $8,523 | $575,100 | $284,200 | $290,900 |
| 2015 | $8,225 | $549,400 | $273,200 | $276,200 |
Source: Public Records
Map
Nearby Homes
- 18 Dale St Unit 9D
- 2 Garfield Ln W
- 72 Tewksbury St
- 1 Delisio Dr
- 11 Rennie Dr
- 6 Hearthstone Place
- 3 West Hollow
- 14 Jill's Way Unit 14
- 105 Central St
- 11 Wyncrest Cir
- 31 Porter Rd
- 56 Sunset Rock Rd
- 3 Torr St
- 4 Hammond Way
- 241 Lowell St Unit 3
- 16 Porter Rd
- 58 Blanchard St
- 3 Regency Ridge
- 8 Stouffer Cir
- 14 Geneva Rd
Your Personal Tour Guide
Ask me questions while you tour the home.