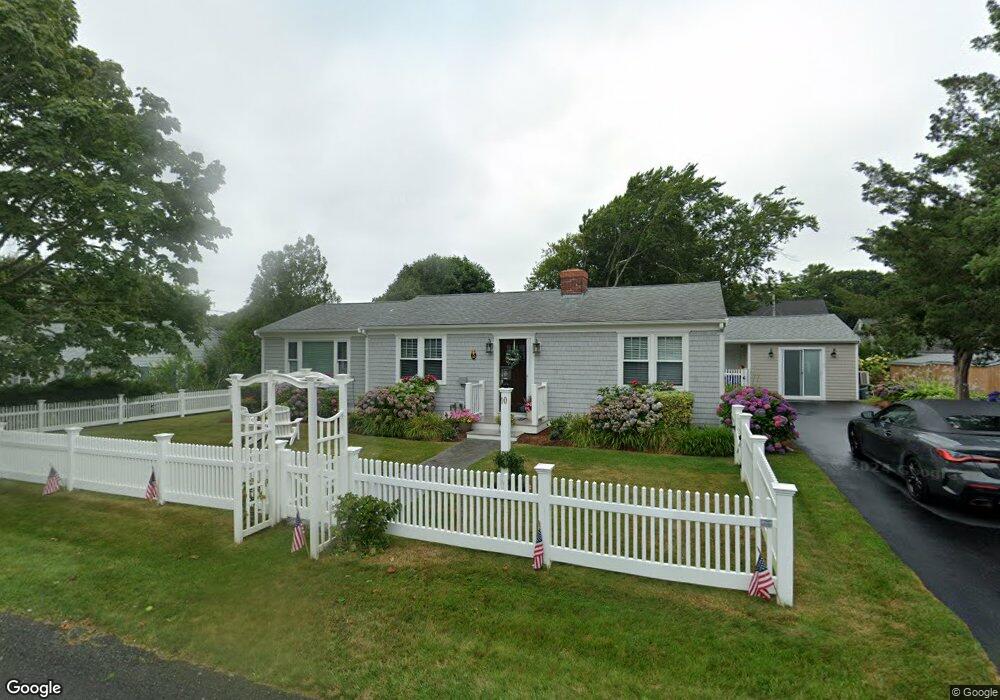
10 Cedar Point Dr Pocasset, MA 02559
Pocasset NeighborhoodEstimated Value: $703,000 - $788,000
2
Beds
1
Bath
1,046
Sq Ft
$709/Sq Ft
Est. Value
About This Home
This home is located at 10 Cedar Point Dr, Pocasset, MA 02559 and is currently estimated at $741,404, approximately $708 per square foot. 10 Cedar Point Dr is a home located in Barnstable County with nearby schools including Bourne High School, Cadence Academy Preschool - Bourne, and Heritage Christian Academy.
Ownership History
Date
Name
Owned For
Owner Type
Purchase Details
Closed on
Dec 18, 2023
Sold by
Norton Agnes H
Bought by
Agnes M Norton Irt and Langill
Current Estimated Value
Purchase Details
Closed on
Jun 29, 2006
Sold by
Norton Agnes H and Norton Frank X
Bought by
Norton Agnes H
Purchase Details
Closed on
Oct 15, 1991
Sold by
Bush Dorothy C
Bought by
Norton Francis X
Home Financials for this Owner
Home Financials are based on the most recent Mortgage that was taken out on this home.
Original Mortgage
$59,500
Interest Rate
9.07%
Mortgage Type
Purchase Money Mortgage
Create a Home Valuation Report for This Property
The Home Valuation Report is an in-depth analysis detailing your home's value as well as a comparison with similar homes in the area
Home Values in the Area
Average Home Value in this Area
Purchase History
| Date | Buyer | Sale Price | Title Company |
|---|---|---|---|
| Agnes M Norton Irt | -- | None Available | |
| Agnes M Norton Irt | -- | None Available | |
| Norton Agnes H | -- | -- | |
| Norton Agnes H | -- | -- | |
| Norton Francis X | $85,000 | -- | |
| Norton Francis X | $85,000 | -- |
Source: Public Records
Mortgage History
| Date | Status | Borrower | Loan Amount |
|---|---|---|---|
| Previous Owner | Norton Francis X | $59,500 |
Source: Public Records
Tax History
| Year | Tax Paid | Tax Assessment Tax Assessment Total Assessment is a certain percentage of the fair market value that is determined by local assessors to be the total taxable value of land and additions on the property. | Land | Improvement |
|---|---|---|---|---|
| 2025 | $5,555 | $711,300 | $382,600 | $328,700 |
| 2024 | $5,433 | $677,400 | $364,400 | $313,000 |
| 2023 | $4,469 | $507,300 | $322,500 | $184,800 |
| 2022 | $4,044 | $400,800 | $253,000 | $147,800 |
| 2021 | $3,935 | $365,400 | $230,200 | $135,200 |
| 2020 | $3,835 | $357,100 | $228,000 | $129,100 |
| 2019 | $3,682 | $350,300 | $228,000 | $122,300 |
| 2018 | $3,409 | $334,100 | $222,800 | $111,300 |
| 2017 | $3,409 | $331,000 | $220,700 | $110,300 |
| 2016 | $3,201 | $315,100 | $209,600 | $105,500 |
| 2015 | $3,007 | $298,600 | $193,100 | $105,500 |
Source: Public Records
Map
Nearby Homes