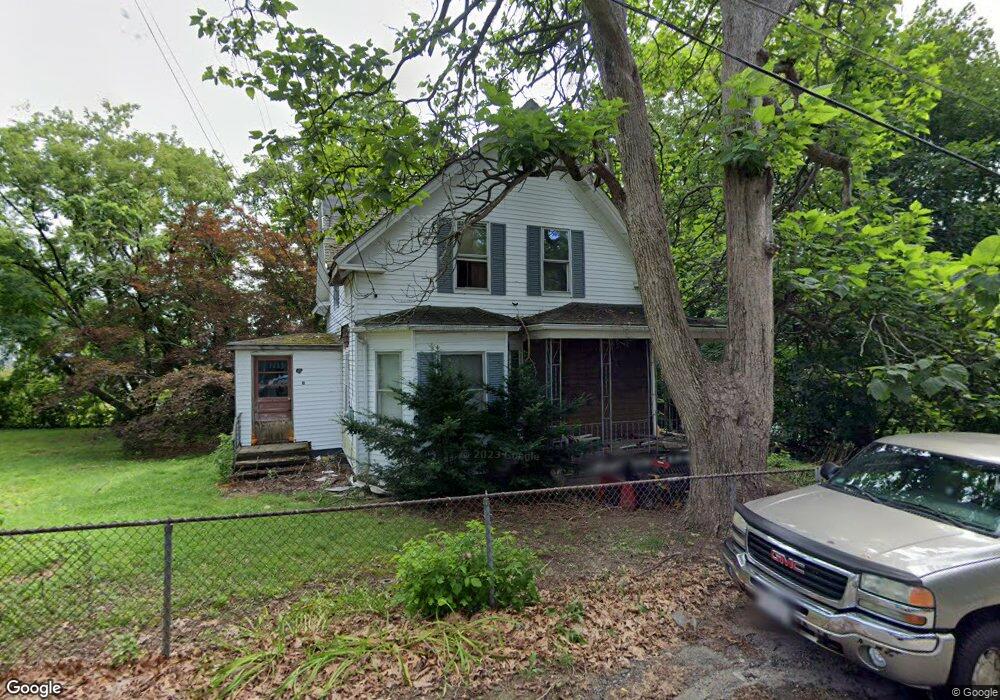
10 Clyde St Blackstone, MA 01504
Estimated Value: $398,000 - $425,000
4
Beds
2
Baths
1,458
Sq Ft
$280/Sq Ft
Est. Value
About This Home
This home is located at 10 Clyde St, Blackstone, MA 01504 and is currently estimated at $407,694, approximately $279 per square foot. 10 Clyde St is a home located in Worcester County with nearby schools including Blackstone-Millville Regional High School, Rise Prep Mayoral Academy Middle School, and Rise Prep Mayoral Academy.
Ownership History
Date
Name
Owned For
Owner Type
Purchase Details
Closed on
Jun 28, 2002
Sold by
Cox David N and Keough Kathy A
Bought by
Cox David N
Current Estimated Value
Purchase Details
Closed on
Jan 14, 1993
Sold by
Oregon Properties Rt
Bought by
Cox David N and Keough Kathy
Home Financials for this Owner
Home Financials are based on the most recent Mortgage that was taken out on this home.
Original Mortgage
$57,600
Interest Rate
8.3%
Mortgage Type
Purchase Money Mortgage
Purchase Details
Closed on
Oct 23, 1987
Sold by
Vetovis John F
Bought by
Paquette Holly J
Home Financials for this Owner
Home Financials are based on the most recent Mortgage that was taken out on this home.
Original Mortgage
$24,000
Interest Rate
11.13%
Create a Home Valuation Report for This Property
The Home Valuation Report is an in-depth analysis detailing your home's value as well as a comparison with similar homes in the area
Home Values in the Area
Average Home Value in this Area
Purchase History
| Date | Buyer | Sale Price | Title Company |
|---|---|---|---|
| Cox David N | $5,000 | -- | |
| Cox David N | $72,000 | -- | |
| Paquette Holly J | $99,900 | -- |
Source: Public Records
Mortgage History
| Date | Status | Borrower | Loan Amount |
|---|---|---|---|
| Previous Owner | Paquette Holly J | $57,600 | |
| Previous Owner | Paquette Holly J | $50,000 | |
| Previous Owner | Paquette Holly J | $24,000 | |
| Previous Owner | Paquette Holly J | $76,000 |
Source: Public Records
Tax History
| Year | Tax Paid | Tax Assessment Tax Assessment Total Assessment is a certain percentage of the fair market value that is determined by local assessors to be the total taxable value of land and additions on the property. | Land | Improvement |
|---|---|---|---|---|
| 2025 | $4,394 | $291,000 | $139,000 | $152,000 |
| 2024 | $4,427 | $271,100 | $139,000 | $132,100 |
| 2023 | $4,315 | $266,700 | $139,000 | $127,700 |
| 2022 | $4,019 | $224,500 | $133,000 | $91,500 |
| 2021 | $2,028 | $206,900 | $120,800 | $86,100 |
| 2020 | $4,023 | $213,300 | $120,800 | $92,500 |
| 2019 | $4,076 | $205,600 | $111,100 | $94,500 |
| 2018 | $10,192 | $189,800 | $105,800 | $84,000 |
| 2017 | $152 | $178,600 | $105,800 | $72,800 |
| 2016 | $9,707 | $177,600 | $97,700 | $79,900 |
| 2015 | $3,347 | $171,800 | $97,700 | $74,100 |
Source: Public Records
Map
Nearby Homes
- 458 Prospect St
- 550 Winter St
- 44 Federal St
- 481 N Main St
- 60 Fairlawn Ave
- 10 Huntington Ave
- 154 156 Winter St
- 11 Federal St
- 83 Summer St
- 130 E School St
- 164 W School St
- 256 Privilege St
- 0 Diamond Hill Rd Unit 1406968
- 40 Valley St
- 308 Harris Ave
- 187 Boyden St
- 107 Blackstone St
- 22 Fox Run Rd
- 76 Main St
- 0 N Main St Unit 1401765
Your Personal Tour Guide
Ask me questions while you tour the home.