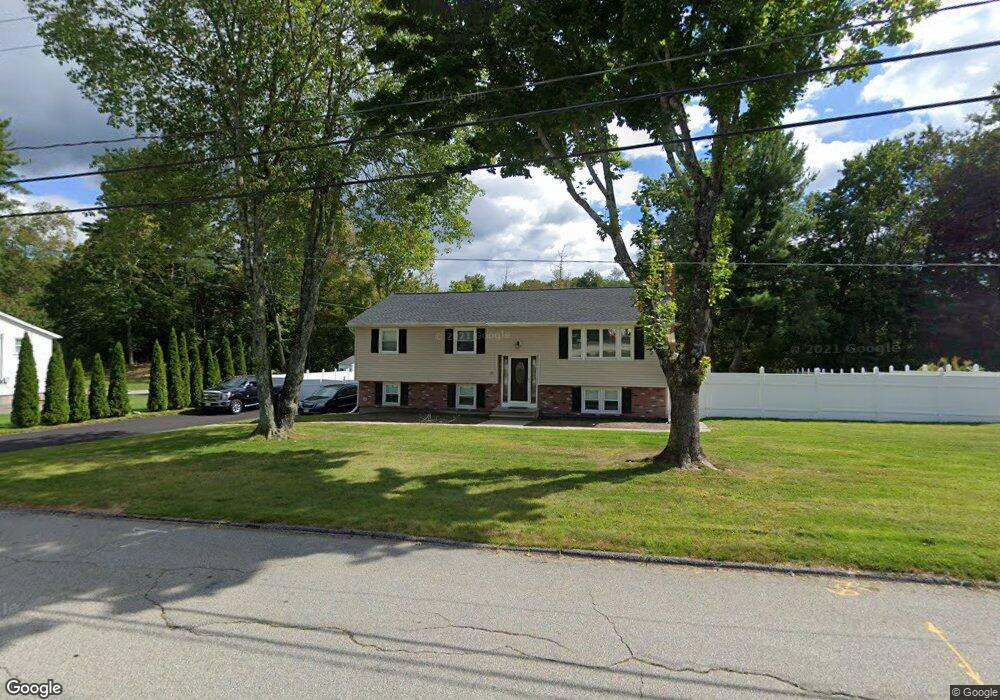
10 Conte Dr Methuen, MA 01844
The West End NeighborhoodEstimated Value: $602,946 - $709,000
3
Beds
2
Baths
1,989
Sq Ft
$332/Sq Ft
Est. Value
About This Home
This home is located at 10 Conte Dr, Methuen, MA 01844 and is currently estimated at $660,487, approximately $332 per square foot. 10 Conte Dr is a home located in Essex County with nearby schools including Marsh Grammar School, Methuen High School, and The Islamic Academy For Peace.
Ownership History
Date
Name
Owned For
Owner Type
Purchase Details
Closed on
Sep 29, 2017
Sold by
Dhondt Brian and Dhondt Kelly A
Bought by
Beauregard Jeffrey
Current Estimated Value
Home Financials for this Owner
Home Financials are based on the most recent Mortgage that was taken out on this home.
Original Mortgage
$394,250
Outstanding Balance
$324,358
Interest Rate
3.89%
Mortgage Type
New Conventional
Estimated Equity
$336,129
Purchase Details
Closed on
Aug 16, 2006
Sold by
Firicano Dina M and Firicano Joseph P
Bought by
Dhondt Brian P and Dhondt Kelly A
Purchase Details
Closed on
Aug 2, 1999
Sold by
Blood Leonard Est and Damour
Bought by
Firicano Dina and Firicano Joseph P
Create a Home Valuation Report for This Property
The Home Valuation Report is an in-depth analysis detailing your home's value as well as a comparison with similar homes in the area
Home Values in the Area
Average Home Value in this Area
Purchase History
| Date | Buyer | Sale Price | Title Company |
|---|---|---|---|
| Beauregard Jeffrey | $415,000 | -- | |
| Dhondt Brian P | $320,000 | -- | |
| Dhondt Brian | $320,000 | -- | |
| Firicano Dina | $185,000 | -- | |
| Firicano Dina M | $185,000 | -- |
Source: Public Records
Mortgage History
| Date | Status | Borrower | Loan Amount |
|---|---|---|---|
| Open | Beauregard Jeffrey | $394,250 | |
| Closed | Beauregard Jeffrey | $394,250 | |
| Previous Owner | Firicano Dina M | $327,763 |
Source: Public Records
Tax History
| Year | Tax Paid | Tax Assessment Tax Assessment Total Assessment is a certain percentage of the fair market value that is determined by local assessors to be the total taxable value of land and additions on the property. | Land | Improvement |
|---|---|---|---|---|
| 2025 | $5,702 | $538,900 | $246,400 | $292,500 |
| 2024 | $5,754 | $529,800 | $224,000 | $305,800 |
| 2023 | $5,446 | $465,500 | $200,000 | $265,500 |
| 2022 | $5,130 | $393,100 | $160,000 | $233,100 |
| 2021 | $4,866 | $368,900 | $152,000 | $216,900 |
| 2020 | $4,828 | $359,200 | $152,000 | $207,200 |
| 2019 | $4,690 | $330,500 | $144,000 | $186,500 |
| 2018 | $4,524 | $317,000 | $144,000 | $173,000 |
| 2017 | $4,347 | $296,700 | $144,000 | $152,700 |
| 2016 | $4,295 | $290,000 | $144,000 | $146,000 |
| 2015 | $4,184 | $286,600 | $144,000 | $142,600 |
Source: Public Records
Map
Nearby Homes
- 3 Oxyoke Dr
- 71 N Lowell St
- 18 Stone Castle Dr Unit 76
- 534 Forest St
- 50 Arrowwood St
- 290 Salem Rd
- 298 Salem Rd
- 302 Salem Rd
- 22 Falcon St
- 65 Clayton Ave
- 16 Green St
- 37 Lexington Ave
- 17 Horseshoe Rd
- 42 Perley St
- 945 Riverside Dr Unit 5B
- 945 Riverside Dr Unit 8A
- 945 Riverside Dr Unit 3B
- 219 Pelham St
- 235 Oakland Ave
- 35 Maplewood Ave
Your Personal Tour Guide
Ask me questions while you tour the home.