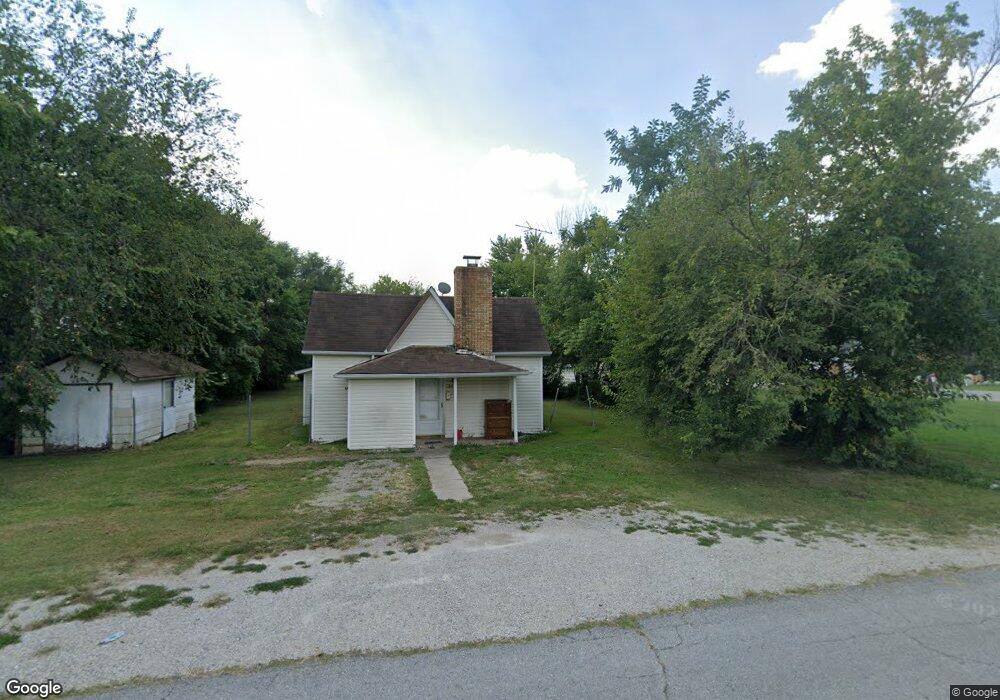
10 E Tyndall St Aurora, MO 65605
Estimated Value: $101,000 - $157,000
2
Beds
2
Baths
1,022
Sq Ft
$120/Sq Ft
Est. Value
About This Home
This home is located at 10 E Tyndall St, Aurora, MO 65605 and is currently estimated at $123,006, approximately $120 per square foot. 10 E Tyndall St is a home located in Lawrence County with nearby schools including Pate Early Childhood Center, Robinson Intermediate School, and Robinson Elementary School.
Ownership History
Date
Name
Owned For
Owner Type
Purchase Details
Closed on
Mar 17, 2023
Sold by
Morfin-Torres Abelardo
Bought by
Villalvazo Sandra Lucila Naran
Current Estimated Value
Purchase Details
Closed on
Mar 1, 2023
Sold by
Timbrel Properties Llc
Bought by
Morfin-Torres Abelardo and Villalvazo Sandra Lucila
Purchase Details
Closed on
Aug 11, 2015
Sold by
Willcut Keith A
Bought by
Timber Properties Llc
Purchase Details
Closed on
Feb 11, 2010
Sold by
American General Financial Services Inc
Bought by
Willcut Keith
Purchase Details
Closed on
Aug 1, 2008
Sold by
Zellers Lonnie D and Zellers Arlis J
Bought by
American General Financial Services Inc
Purchase Details
Closed on
Mar 21, 2006
Sold by
Nieters Gerard A
Bought by
American General Financial Services Inc
Purchase Details
Closed on
Mar 13, 2006
Sold by
Bower Donna
Bought by
Zellers Lonnie D and Zellers Arlis J
Create a Home Valuation Report for This Property
The Home Valuation Report is an in-depth analysis detailing your home's value as well as a comparison with similar homes in the area
Home Values in the Area
Average Home Value in this Area
Purchase History
| Date | Buyer | Sale Price | Title Company |
|---|---|---|---|
| Villalvazo Sandra Lucila Naran | -- | -- | |
| Morfin-Torres Abelardo | -- | -- | |
| Timber Properties Llc | -- | Titan Title | |
| Willcut Keith | -- | Ttp | |
| American General Financial Services Inc | $25,000 | None Available | |
| American General Financial Services Inc | $25,000 | -- | |
| Zellers Lonnie D | -- | None Available |
Source: Public Records
Tax History
| Year | Tax Paid | Tax Assessment Tax Assessment Total Assessment is a certain percentage of the fair market value that is determined by local assessors to be the total taxable value of land and additions on the property. | Land | Improvement |
|---|---|---|---|---|
| 2025 | $465 | $9,290 | $1,690 | $7,600 |
| 2024 | $431 | $8,550 | $1,690 | $6,860 |
| 2023 | $429 | $8,550 | $1,690 | $6,860 |
| 2022 | $404 | $8,060 | $1,690 | $6,370 |
| 2021 | $405 | $8,060 | $1,690 | $6,370 |
| 2020 | $376 | $7,420 | $1,050 | $6,370 |
| 2019 | $370 | $7,420 | $1,050 | $6,370 |
| 2018 | $369 | $7,420 | $1,050 | $6,370 |
| 2017 | $367 | $7,420 | $1,050 | $6,370 |
| 2016 | -- | $6,790 | $1,050 | $5,740 |
| 2015 | -- | $6,790 | $1,050 | $5,740 |
| 2014 | -- | $6,790 | $1,050 | $5,740 |
Source: Public Records
Map
Nearby Homes
- 111 W Cofield St
- 503 Mcnatt Ave
- 123 Cofield St
- 225 Morgan Ave
- 111 W Lee St
- 722 Wilson Ave
- 000 Crescent St
- 427 N Harrison Ave
- 216 S Elliott Ave
- 220 S Park Ave
- 141 W Pleasant St
- 303 N Hudson Ave
- 312 S Oak Ave
- 114 E College St
- 311 W Pleasant St
- 330 W Summit St
- 213 W College St
- 405 W Summit St
- 407 W Summit St Unit A & B
- 421 W College St
- 10 E Tyndal St
- 10 E Tyndal St
- 326 Mc Natt Ave
- 18 E Tyndall St
- 326 Mcnatt Ave
- 325 & 326 Mcnatt
- 20 W Tyndal St
- 000 Tyndall St
- 19 E Tyndall St
- 21 E Tyndall St
- 317 Mc Natt Ave
- 317 Mc Natt Ave Unit 1303255
- 21 E Tyndal St
- 325 Mcnatt Ave
- 102 E Tyndal St
- 315 Mcnatt Ave
- 315 Mc Natt Ave
- 21 W Cofield St
- 21 W Cofield St
- 9 W Tyndal St
Your Personal Tour Guide
Ask me questions while you tour the home.