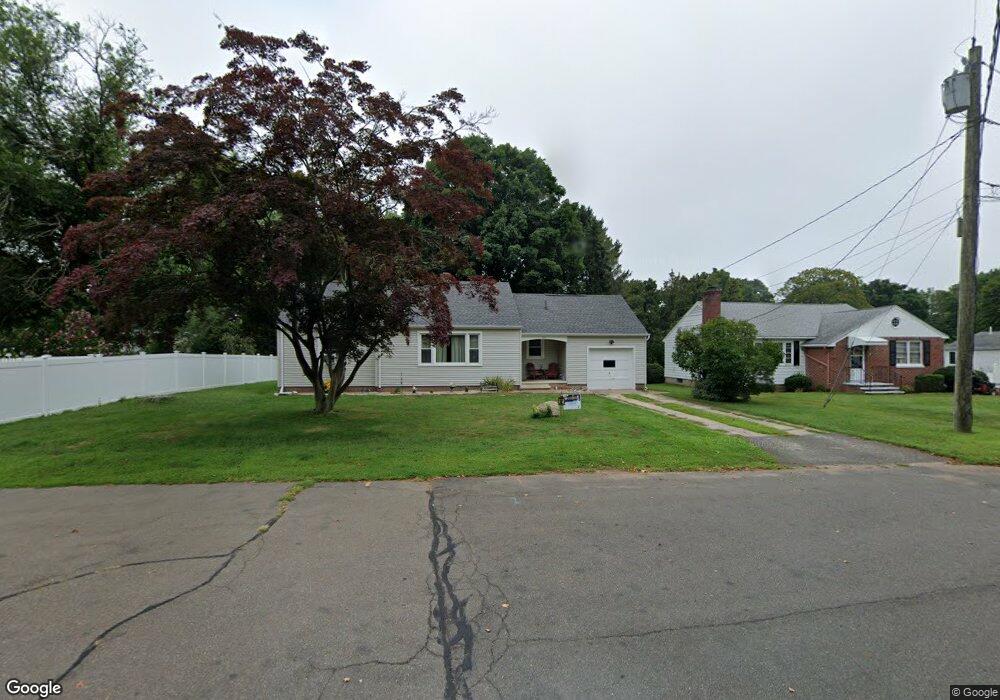
10 Field Place Branford, CT 06405
Estimated Value: $412,000 - $466,637
3
Beds
6
Baths
1,154
Sq Ft
$374/Sq Ft
Est. Value
About This Home
This home is located at 10 Field Place, Branford, CT 06405 and is currently estimated at $431,909, approximately $374 per square foot. 10 Field Place is a home located in New Haven County with nearby schools including Francis Walsh Intermediate School, Branford High School, and East Shoreline Catholic Academy.
Ownership History
Date
Name
Owned For
Owner Type
Purchase Details
Closed on
Jun 28, 2011
Sold by
Es Shebell Catherine T and Shebell David R
Bought by
Genovese Peter A and Genovese Marguerite
Current Estimated Value
Purchase Details
Closed on
Sep 21, 1999
Sold by
Field Eileen M and Field Richard M
Bought by
Province Land Acq Llc
Home Financials for this Owner
Home Financials are based on the most recent Mortgage that was taken out on this home.
Original Mortgage
$166,800
Interest Rate
7.83%
Create a Home Valuation Report for This Property
The Home Valuation Report is an in-depth analysis detailing your home's value as well as a comparison with similar homes in the area
Home Values in the Area
Average Home Value in this Area
Purchase History
| Date | Buyer | Sale Price | Title Company |
|---|---|---|---|
| Genovese Peter A | $215,000 | -- | |
| Province Land Acq Llc | $78,000 | -- |
Source: Public Records
Mortgage History
| Date | Status | Borrower | Loan Amount |
|---|---|---|---|
| Previous Owner | Province Land Acq Llc | $166,800 |
Source: Public Records
Tax History Compared to Growth
Tax History
| Year | Tax Paid | Tax Assessment Tax Assessment Total Assessment is a certain percentage of the fair market value that is determined by local assessors to be the total taxable value of land and additions on the property. | Land | Improvement |
|---|---|---|---|---|
| 2025 | $6,270 | $293,000 | $119,500 | $173,500 |
| 2024 | $5,453 | $178,900 | $94,100 | $84,800 |
| 2023 | $5,347 | $178,900 | $94,100 | $84,800 |
| 2022 | $5,269 | $178,900 | $94,100 | $84,800 |
| 2021 | $5,269 | $178,900 | $94,100 | $84,800 |
| 2020 | $5,174 | $178,900 | $94,100 | $84,800 |
| 2019 | $4,736 | $162,900 | $87,400 | $75,500 |
| 2018 | $4,665 | $162,900 | $87,400 | $75,500 |
| 2017 | $4,638 | $162,900 | $87,400 | $75,500 |
| 2016 | $4,465 | $162,900 | $87,400 | $75,500 |
| 2015 | $4,387 | $162,900 | $87,400 | $75,500 |
| 2014 | $4,700 | $179,100 | $97,400 | $81,700 |
Source: Public Records
Map
Nearby Homes
- 62 S Montowese St
- 25 S Montowese St
- 16 Pine Orchard Rd Unit 23
- 74 Quarry Dock Rd
- 60 Maple St Unit 40B
- 58 Quarry Dock Rd
- 86 Pine Orchard Rd
- 42 Waverly Rd
- 76 Limewood Ave
- 49 Riverside Dr
- 40 Linden Shores
- 21 Harbor St
- 85 Ivy St
- 2 W Haycock Point Rd
- 15 River Rd
- 175 Pine Orchard Rd
- 29 Seaview Ave
- 301 Maple St
- 18 Linsley St
- 26 N Main St Unit TRLR 19