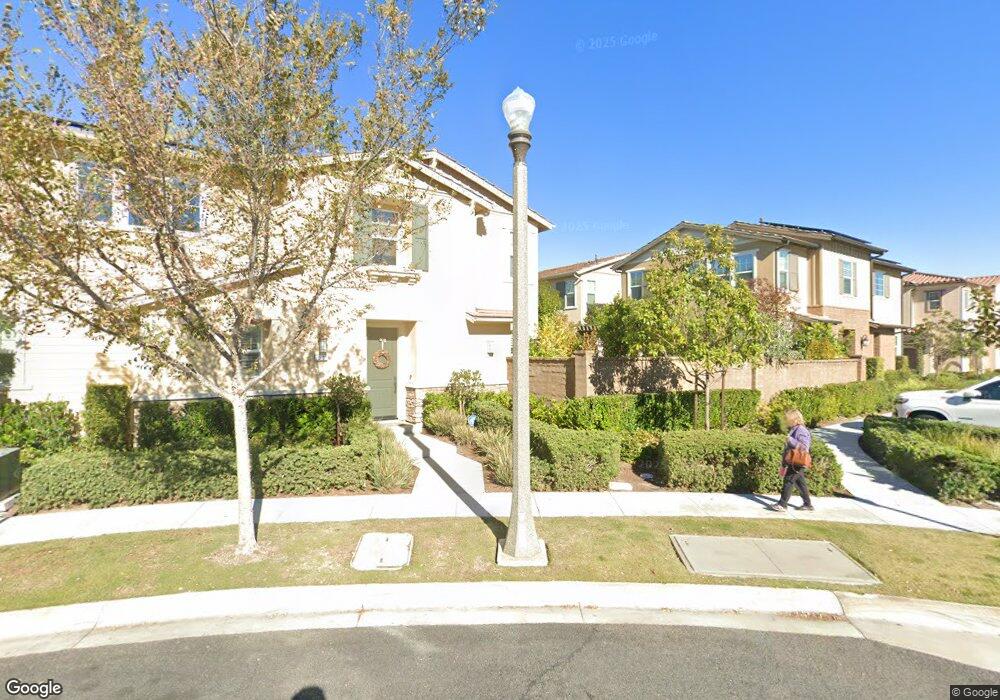
10 Fosco St Rancho Mission Viejo, CA 92694
Estimated Value: $1,202,000 - $1,482,000
3
Beds
3
Baths
1,927
Sq Ft
$668/Sq Ft
Est. Value
About This Home
This home is located at 10 Fosco St, Rancho Mission Viejo, CA 92694 and is currently estimated at $1,287,116, approximately $667 per square foot. 10 Fosco St is a home with nearby schools including Esencia and Tesoro High School.
Ownership History
Date
Name
Owned For
Owner Type
Purchase Details
Closed on
Nov 10, 2020
Sold by
Barragan Steven Michael and Barragan Rae Lynn
Bought by
Barragan Steven Michael and Barragan Rae Lynn
Current Estimated Value
Purchase Details
Closed on
Dec 27, 2017
Sold by
Tri Pointe Homes Inc
Bought by
Barragan Steven M and Wiggins Rae Lynn
Home Financials for this Owner
Home Financials are based on the most recent Mortgage that was taken out on this home.
Original Mortgage
$584,958
Interest Rate
3.95%
Mortgage Type
New Conventional
Create a Home Valuation Report for This Property
The Home Valuation Report is an in-depth analysis detailing your home's value as well as a comparison with similar homes in the area
Home Values in the Area
Average Home Value in this Area
Purchase History
| Date | Buyer | Sale Price | Title Company |
|---|---|---|---|
| Barragan Steven Michael | -- | None Available | |
| Barragan Steven Michael | -- | None Available | |
| Barragan Steven M | $731,500 | First American Title Hsd |
Source: Public Records
Mortgage History
| Date | Status | Borrower | Loan Amount |
|---|---|---|---|
| Previous Owner | Barragan Steven M | $584,958 |
Source: Public Records
Tax History Compared to Growth
Tax History
| Year | Tax Paid | Tax Assessment Tax Assessment Total Assessment is a certain percentage of the fair market value that is determined by local assessors to be the total taxable value of land and additions on the property. | Land | Improvement |
|---|---|---|---|---|
| 2025 | $13,924 | $831,975 | $409,497 | $422,478 |
| 2024 | $13,924 | $815,662 | $401,467 | $414,195 |
| 2023 | $13,881 | $799,669 | $393,595 | $406,074 |
| 2022 | $13,637 | $783,990 | $385,878 | $398,112 |
| 2021 | $13,459 | $768,618 | $378,312 | $390,306 |
| 2020 | $13,178 | $760,737 | $374,433 | $386,304 |
| 2019 | $13,750 | $745,821 | $367,091 | $378,730 |
| 2018 | $9,740 | $331,354 | $331,354 | $0 |
| 2017 | $7,886 | $324,857 | $324,857 | $0 |
Source: Public Records
Map
Nearby Homes