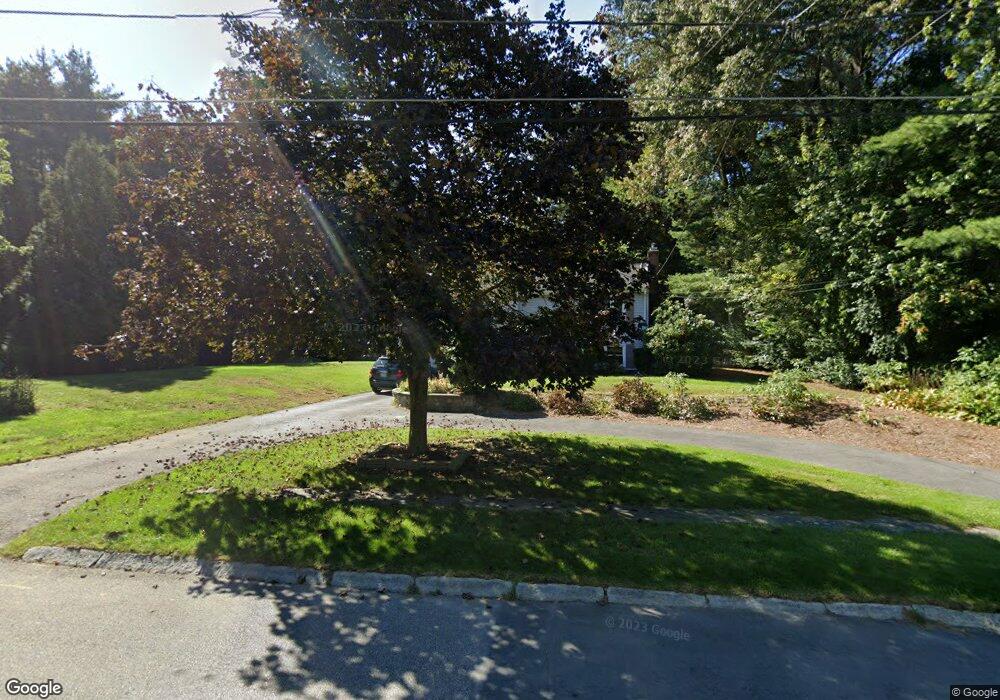
10 Harlow Rd Foxboro, MA 02035
Estimated Value: $591,079 - $739,000
3
Beds
2
Baths
1,052
Sq Ft
$616/Sq Ft
Est. Value
About This Home
This home is located at 10 Harlow Rd, Foxboro, MA 02035 and is currently estimated at $648,520, approximately $616 per square foot. 10 Harlow Rd is a home located in Norfolk County with nearby schools including Foxborough High School, Foxborough Regional Charter School, and The Sage School.
Ownership History
Date
Name
Owned For
Owner Type
Purchase Details
Closed on
May 20, 1987
Sold by
Kelly James M
Bought by
Bernstein Robert M
Current Estimated Value
Create a Home Valuation Report for This Property
The Home Valuation Report is an in-depth analysis detailing your home's value as well as a comparison with similar homes in the area
Home Values in the Area
Average Home Value in this Area
Purchase History
| Date | Buyer | Sale Price | Title Company |
|---|---|---|---|
| Bernstein Robert M | $160,000 | -- |
Source: Public Records
Mortgage History
| Date | Status | Borrower | Loan Amount |
|---|---|---|---|
| Open | Bernstein Robert M | $210,000 | |
| Closed | Bernstein Robert M | $12,000 | |
| Closed | Bernstein Robert M | $60,000 |
Source: Public Records
Tax History Compared to Growth
Tax History
| Year | Tax Paid | Tax Assessment Tax Assessment Total Assessment is a certain percentage of the fair market value that is determined by local assessors to be the total taxable value of land and additions on the property. | Land | Improvement |
|---|---|---|---|---|
| 2025 | $6,482 | $490,300 | $219,100 | $271,200 |
| 2024 | $6,351 | $470,100 | $219,100 | $251,000 |
| 2023 | $6,161 | $433,600 | $208,600 | $225,000 |
| 2022 | $5,949 | $409,700 | $199,500 | $210,200 |
| 2021 | $5,511 | $373,900 | $181,400 | $192,500 |
| 2020 | $5,148 | $353,300 | $181,400 | $171,900 |
| 2019 | $5,049 | $343,500 | $172,700 | $170,800 |
| 2018 | $4,811 | $330,200 | $172,700 | $157,500 |
| 2017 | $4,689 | $311,800 | $161,400 | $150,400 |
| 2016 | $4,636 | $312,800 | $155,300 | $157,500 |
| 2015 | $4,428 | $291,500 | $131,200 | $160,300 |
| 2014 | $4,331 | $288,900 | $128,600 | $160,300 |
Source: Public Records
Map
Nearby Homes
- 137 Beach St
- 2 Thompson Rd
- 35 Shoreline Dr
- 16R Eldor Dr
- 73 Ridge Rd
- 375 Winter St
- 1 Eisenhauer Ln
- 1 Roseland St Unit A-1
- 1549 Washington St Unit A
- 14 Foxhill Rd
- 186 Mechanic St
- 7 Hill St Unit 10
- 180 Old Post Rd Unit 202
- 180 Old Post Rd Unit 206
- 180 Old Post Rd Unit 201
- 180 Old Post Rd Unit 207
- 91 Old Post Rd
- 97 Old Post Rd
- 11 Goodwin Dr
- 131 Washington St Unit 42