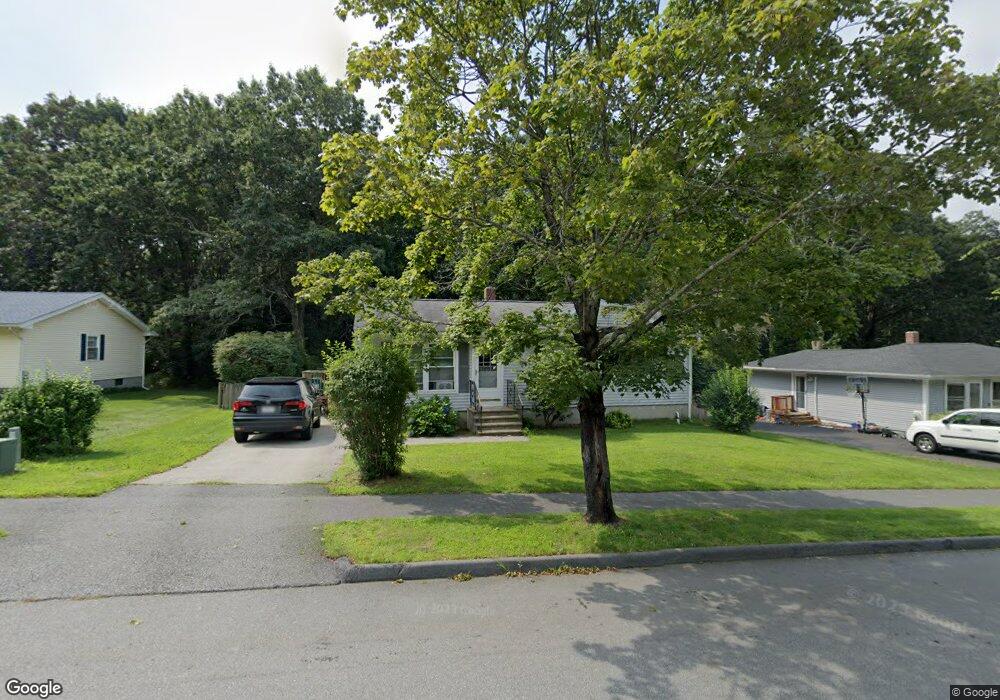
10 Hingham Rd Worcester, MA 01606
Indian Hill NeighborhoodEstimated Value: $454,000 - $498,000
4
Beds
2
Baths
1,282
Sq Ft
$370/Sq Ft
Est. Value
About This Home
This home is located at 10 Hingham Rd, Worcester, MA 01606 and is currently estimated at $473,916, approximately $369 per square foot. 10 Hingham Rd is a home located in Worcester County with nearby schools including Nelson Place Elementary School, Jacob Hiatt Magnet School, and Chandler Magnet.
Ownership History
Date
Name
Owned For
Owner Type
Purchase Details
Closed on
Jun 3, 2008
Sold by
Shairman Doris C and Shairman Penny M
Bought by
Shairman Penny M
Current Estimated Value
Purchase Details
Closed on
Mar 26, 2007
Sold by
Sullivan Paul K and Sullivan Penny M
Bought by
Shairman Doris C and Shairman Penny M
Home Financials for this Owner
Home Financials are based on the most recent Mortgage that was taken out on this home.
Original Mortgage
$150,000
Interest Rate
6.33%
Mortgage Type
Purchase Money Mortgage
Purchase Details
Closed on
Aug 4, 1995
Sold by
Bellows Paul F and Bellows Judith
Bought by
Sullivan Paul K and Sullivan Penny
Home Financials for this Owner
Home Financials are based on the most recent Mortgage that was taken out on this home.
Original Mortgage
$89,252
Interest Rate
7.48%
Mortgage Type
Purchase Money Mortgage
Create a Home Valuation Report for This Property
The Home Valuation Report is an in-depth analysis detailing your home's value as well as a comparison with similar homes in the area
Home Values in the Area
Average Home Value in this Area
Purchase History
| Date | Buyer | Sale Price | Title Company |
|---|---|---|---|
| Shairman Penny M | -- | -- | |
| Shairman Doris C | -- | -- | |
| Sullivan Paul K | $119,000 | -- |
Source: Public Records
Mortgage History
| Date | Status | Borrower | Loan Amount |
|---|---|---|---|
| Previous Owner | Shairman Doris C | $150,000 | |
| Previous Owner | Sullivan Paul K | $89,252 |
Source: Public Records
Tax History
| Year | Tax Paid | Tax Assessment Tax Assessment Total Assessment is a certain percentage of the fair market value that is determined by local assessors to be the total taxable value of land and additions on the property. | Land | Improvement |
|---|---|---|---|---|
| 2025 | $5,418 | $410,800 | $118,700 | $292,100 |
| 2024 | $5,298 | $385,300 | $118,700 | $266,600 |
| 2023 | $5,230 | $364,700 | $103,200 | $261,500 |
| 2022 | $4,659 | $306,300 | $82,600 | $223,700 |
| 2021 | $4,622 | $283,900 | $66,100 | $217,800 |
| 2020 | $4,432 | $260,700 | $66,100 | $194,600 |
| 2019 | $4,174 | $231,900 | $59,500 | $172,400 |
| 2018 | $4,039 | $213,600 | $59,500 | $154,100 |
| 2017 | $4,105 | $213,600 | $59,500 | $154,100 |
| 2016 | $4,056 | $196,800 | $43,700 | $153,100 |
| 2015 | $3,950 | $196,800 | $43,700 | $153,100 |
| 2014 | $3,845 | $196,800 | $43,700 | $153,100 |
Source: Public Records
Map
Nearby Homes
- 36 Sunrise Ave
- 270 Brattle St
- 37 Mohave Rd
- 42 N Worcester Ave
- 30 Danielles Way
- 18 Danielles Way
- 23 Leslie Rd
- 3 Torrey Ln
- 39 Mountainshire Dr
- 82 Holden St
- 90 Bjorklund Ave
- 34 Doyle Rd
- 12 Pinecroft Ave
- 158 Chester St
- 97 Parkton Ave
- 39 Whitmarsh Ave
- 53 Collins St
- 18 Gosnold St
- 94 Kendrick Ave
- 25 Chester St
Your Personal Tour Guide
Ask me questions while you tour the home.