Estimated Value: $1,687,000 - $1,920,000
5
Beds
4
Baths
3,829
Sq Ft
$461/Sq Ft
Est. Value
About This Home
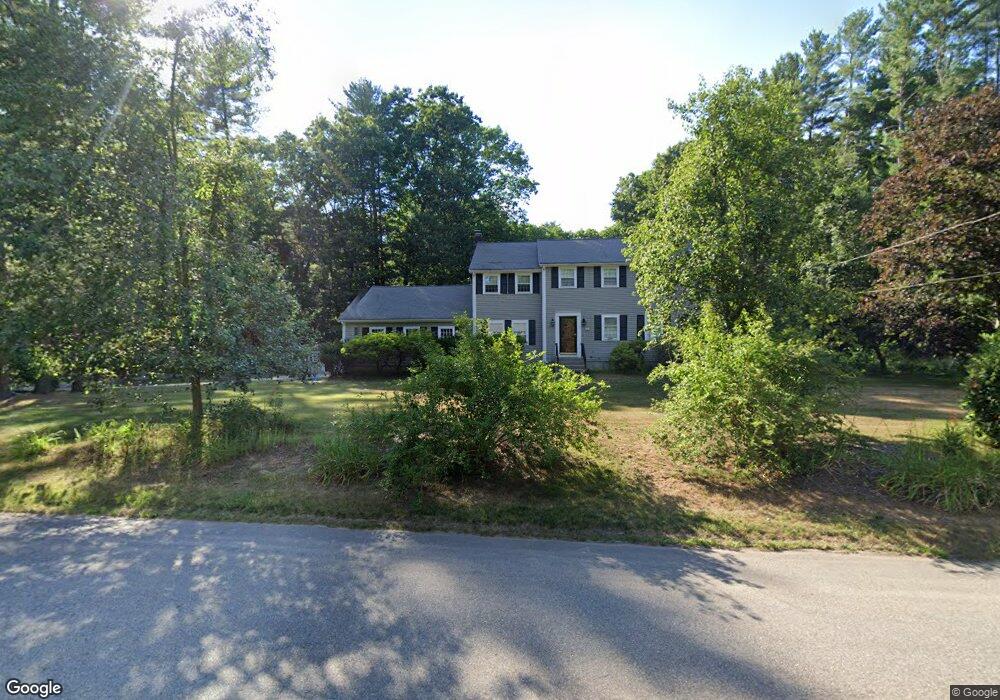
This home is located at 10 Juniper Ln, Dover, MA 02030 and is currently estimated at $1,764,461, approximately $460 per square foot. 10 Juniper Ln is a home located in Norfolk County with nearby schools including Chickering Elementary School, Dover-Sherborn Regional Middle School, and Dover-Sherborn Regional High School.
Ownership History
Date
Name
Owned For
Owner Type
Purchase Details
Closed on
Jun 17, 2002
Sold by
Duke Virginia D and Duke Lester P
Bought by
Turo Lisa S and Turo Joseph T
Current Estimated Value
Home Financials for this Owner
Home Financials are based on the most recent Mortgage that was taken out on this home.
Original Mortgage
$400,000
Interest Rate
6.8%
Mortgage Type
Purchase Money Mortgage
Purchase Details
Closed on
Nov 29, 1993
Sold by
Merrill Geoffrey G and Merrill Sara S
Bought by
Duke Virginia D and Duke Lester P
Home Financials for this Owner
Home Financials are based on the most recent Mortgage that was taken out on this home.
Original Mortgage
$268,000
Interest Rate
6.72%
Mortgage Type
Purchase Money Mortgage
Create a Home Valuation Report for This Property
The Home Valuation Report is an in-depth analysis detailing your home's value as well as a comparison with similar homes in the area
Home Values in the Area
Average Home Value in this Area
Purchase History
| Date | Buyer | Sale Price | Title Company |
|---|---|---|---|
| Turo Lisa S | $725,000 | -- | |
| Duke Virginia D | $378,000 | -- |
Source: Public Records
Mortgage History
| Date | Status | Borrower | Loan Amount |
|---|---|---|---|
| Open | Duke Virginia D | $307,000 | |
| Closed | Duke Virginia D | $315,000 | |
| Closed | Duke Virginia D | $100,000 | |
| Closed | Turo Lisa S | $400,000 | |
| Previous Owner | Duke Virginia D | $268,000 |
Source: Public Records
Tax History
| Year | Tax Paid | Tax Assessment Tax Assessment Total Assessment is a certain percentage of the fair market value that is determined by local assessors to be the total taxable value of land and additions on the property. | Land | Improvement |
|---|---|---|---|---|
| 2025 | $17,156 | $1,522,300 | $642,600 | $879,700 |
| 2024 | $15,828 | $1,444,200 | $620,800 | $823,400 |
| 2023 | $15,240 | $1,250,200 | $544,600 | $705,600 |
| 2022 | $14,206 | $1,143,800 | $522,800 | $621,000 |
| 2021 | $14,452 | $1,121,200 | $522,800 | $598,400 |
| 2020 | $14,396 | $1,121,200 | $522,800 | $598,400 |
| 2019 | $14,497 | $1,121,200 | $522,800 | $598,400 |
| 2018 | $13,031 | $1,014,900 | $522,800 | $492,100 |
| 2017 | $12,490 | $957,100 | $479,300 | $477,800 |
| 2016 | $12,327 | $957,100 | $479,300 | $477,800 |
| 2015 | $11,473 | $903,400 | $455,300 | $448,100 |
Source: Public Records
Map
Nearby Homes
- 62 Claybrook Rd
- 60 Claybrook Rd
- 1 Old Colony Dr
- 52 Willow St
- 1780 Central Ave
- 365 Charles River St
- 24 Moseley Ave
- 68 Locust Ln
- 362 Country Way
- 34 Stratford Rd
- 1 Mill St
- 1266 South St
- 37 Carleton Dr
- 25 Bretton Rd
- 182 Winding River Rd
- 9 Buttercup Ln
- 8 Warren Rd
- 104 Glen St
- 121 Livingston Rd
- 189 Bridle Trail Rd
Your Personal Tour Guide
Ask me questions while you tour the home.