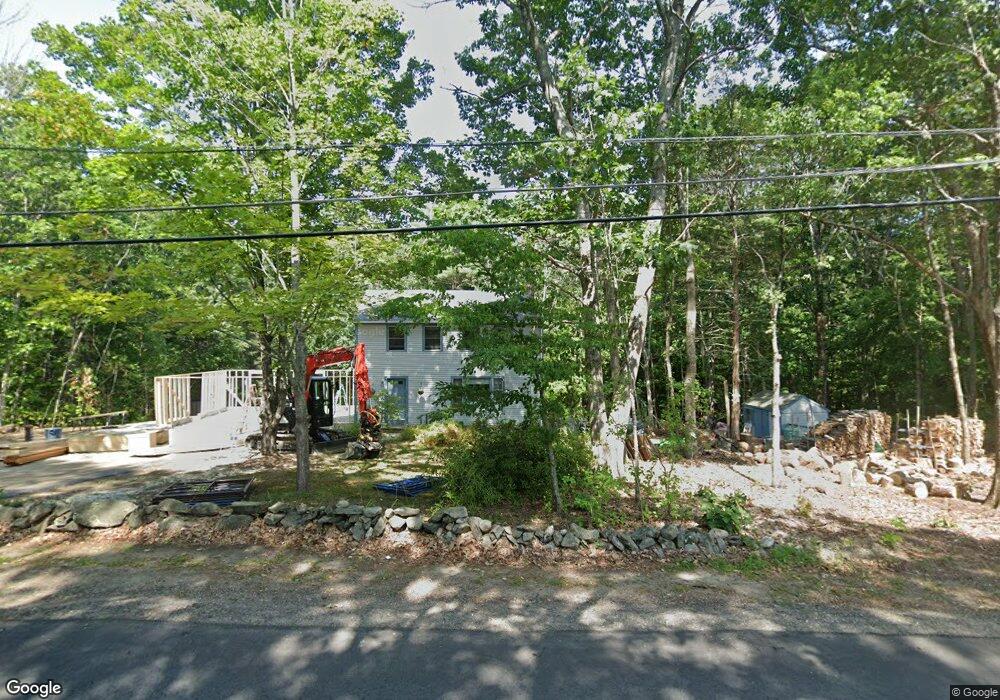
10 Kelsey Rd Unit 4-10 Lee, NH 03861
Estimated Value: $474,000 - $532,000
3
Beds
3
Baths
1,764
Sq Ft
$283/Sq Ft
Est. Value
About This Home
This home is located at 10 Kelsey Rd Unit 4-10, Lee, NH 03861 and is currently estimated at $498,548, approximately $282 per square foot. 10 Kelsey Rd Unit 4-10 is a home located in Strafford County with nearby schools including Mast Way School, Oyster River Middle School, and Oyster River High School.
Ownership History
Date
Name
Owned For
Owner Type
Purchase Details
Closed on
Jul 26, 2023
Sold by
Thomas M Laue Ret and Laue
Bought by
Blowen Andrew and Garfield Lindsay
Current Estimated Value
Home Financials for this Owner
Home Financials are based on the most recent Mortgage that was taken out on this home.
Original Mortgage
$418,000
Outstanding Balance
$408,261
Interest Rate
6.69%
Mortgage Type
Purchase Money Mortgage
Estimated Equity
$90,287
Purchase Details
Closed on
Jan 30, 2019
Sold by
Laue Thomas M and Sullivan Janet R
Bought by
Janet R Sullivan Ret and Laue
Create a Home Valuation Report for This Property
The Home Valuation Report is an in-depth analysis detailing your home's value as well as a comparison with similar homes in the area
Home Values in the Area
Average Home Value in this Area
Purchase History
| Date | Buyer | Sale Price | Title Company |
|---|---|---|---|
| Blowen Andrew | $440,000 | None Available | |
| Janet R Sullivan Ret | -- | -- |
Source: Public Records
Mortgage History
| Date | Status | Borrower | Loan Amount |
|---|---|---|---|
| Open | Blowen Andrew | $418,000 |
Source: Public Records
Tax History Compared to Growth
Tax History
| Year | Tax Paid | Tax Assessment Tax Assessment Total Assessment is a certain percentage of the fair market value that is determined by local assessors to be the total taxable value of land and additions on the property. | Land | Improvement |
|---|---|---|---|---|
| 2024 | $8,754 | $339,700 | $203,200 | $136,500 |
| 2023 | $7,989 | $338,100 | $203,200 | $134,900 |
| 2022 | $7,344 | $338,100 | $203,200 | $134,900 |
| 2021 | $7,360 | $338,100 | $203,200 | $134,900 |
| 2020 | $6,251 | $196,200 | $93,700 | $102,500 |
| 2019 | $6,178 | $196,200 | $93,700 | $102,500 |
| 2018 | $5,998 | $196,200 | $93,700 | $102,500 |
| 2017 | $5,874 | $196,200 | $93,700 | $102,500 |
| 2016 | $5,739 | $196,200 | $93,700 | $102,500 |
| 2015 | $5,675 | $194,000 | $88,200 | $105,800 |
| 2014 | $5,762 | $194,000 | $88,200 | $105,800 |
| 2012 | $5,808 | $194,000 | $88,200 | $105,800 |
Source: Public Records
Map
Nearby Homes