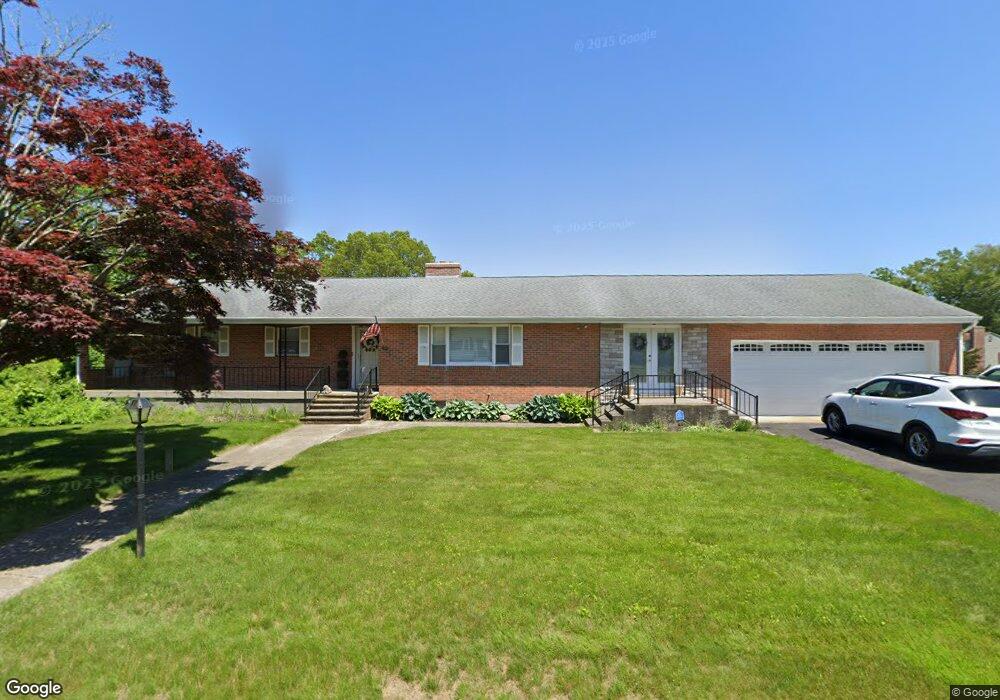
10 Laurel Hill Dr Westerly, RI 02891
Estimated Value: $604,000 - $640,807
3
Beds
3
Baths
2,992
Sq Ft
$209/Sq Ft
Est. Value
About This Home
This home is located at 10 Laurel Hill Dr, Westerly, RI 02891 and is currently estimated at $623,952, approximately $208 per square foot. 10 Laurel Hill Dr is a home located in Washington County with nearby schools including Westerly High School, North Stonington Christian Academy, and St. Michael School.
Ownership History
Date
Name
Owned For
Owner Type
Purchase Details
Closed on
Oct 13, 2011
Sold by
Diniz John A
Bought by
Diniz John A and Diniz Mary F
Current Estimated Value
Home Financials for this Owner
Home Financials are based on the most recent Mortgage that was taken out on this home.
Original Mortgage
$200,000
Interest Rate
4.52%
Mortgage Type
Purchase Money Mortgage
Purchase Details
Closed on
Sep 6, 2011
Sold by
Kasztner Kamilla Est
Bought by
Diniz John A
Home Financials for this Owner
Home Financials are based on the most recent Mortgage that was taken out on this home.
Original Mortgage
$200,000
Interest Rate
4.52%
Mortgage Type
Purchase Money Mortgage
Create a Home Valuation Report for This Property
The Home Valuation Report is an in-depth analysis detailing your home's value as well as a comparison with similar homes in the area
Home Values in the Area
Average Home Value in this Area
Purchase History
| Date | Buyer | Sale Price | Title Company |
|---|---|---|---|
| Diniz John A | -- | -- | |
| Diniz John A | $250,000 | -- |
Source: Public Records
Mortgage History
| Date | Status | Borrower | Loan Amount |
|---|---|---|---|
| Open | Diniz John A | $190,000 | |
| Closed | Diniz John A | $200,000 | |
| Previous Owner | Diniz John A | $115,000 |
Source: Public Records
Tax History Compared to Growth
Tax History
| Year | Tax Paid | Tax Assessment Tax Assessment Total Assessment is a certain percentage of the fair market value that is determined by local assessors to be the total taxable value of land and additions on the property. | Land | Improvement |
|---|---|---|---|---|
| 2025 | $4,287 | $551,000 | $186,400 | $364,600 |
| 2024 | $4,164 | $398,500 | $133,200 | $265,300 |
| 2023 | $4,049 | $398,500 | $133,200 | $265,300 |
| 2022 | $4,025 | $398,500 | $133,200 | $265,300 |
| 2021 | $3,893 | $322,800 | $115,800 | $207,000 |
| 2020 | $3,825 | $322,800 | $115,800 | $207,000 |
| 2019 | $3,790 | $322,800 | $115,800 | $207,000 |
| 2018 | $3,538 | $286,500 | $115,800 | $170,700 |
| 2017 | $3,438 | $286,500 | $115,800 | $170,700 |
| 2016 | $3,438 | $286,500 | $115,800 | $170,700 |
| 2015 | $3,518 | $313,300 | $123,600 | $189,700 |
| 2014 | $3,462 | $313,300 | $123,600 | $189,700 |
Source: Public Records
Map
Nearby Homes