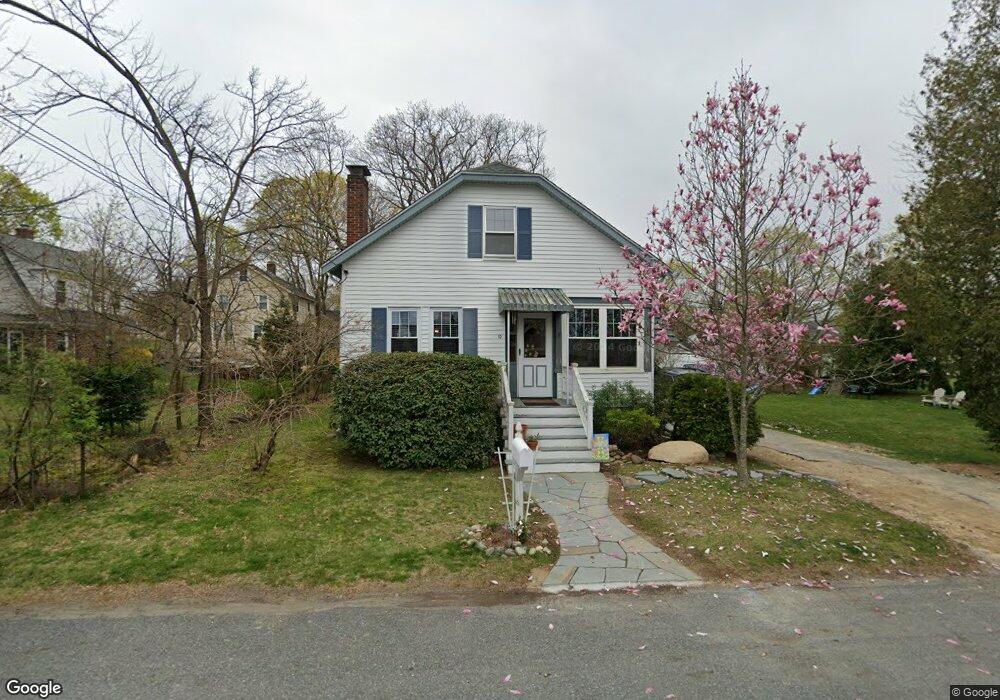
10 Magnolia St Framingham, MA 01701
Estimated Value: $591,412 - $646,000
4
Beds
1
Bath
1,564
Sq Ft
$399/Sq Ft
Est. Value
About This Home
This home is located at 10 Magnolia St, Framingham, MA 01701 and is currently estimated at $624,103, approximately $399 per square foot. 10 Magnolia St is a home located in Middlesex County with nearby schools including Framingham High School, Christa McAuliffe Charter School, and Happy Hollow School.
Ownership History
Date
Name
Owned For
Owner Type
Purchase Details
Closed on
Jan 11, 2017
Sold by
Cote Marc A
Bought by
Cote Marc A and Cote Lara
Current Estimated Value
Purchase Details
Closed on
Jun 28, 2005
Sold by
Stickles Beverly J and Krasnow Joshua M
Bought by
Cote Marc A
Home Financials for this Owner
Home Financials are based on the most recent Mortgage that was taken out on this home.
Original Mortgage
$345,260
Interest Rate
5.82%
Mortgage Type
Purchase Money Mortgage
Purchase Details
Closed on
Jan 17, 2002
Sold by
Mcfarlane Donna J
Bought by
Krasnow Joshua M and Stickles Beverly J
Home Financials for this Owner
Home Financials are based on the most recent Mortgage that was taken out on this home.
Original Mortgage
$212,549
Interest Rate
6.84%
Mortgage Type
Purchase Money Mortgage
Purchase Details
Closed on
Mar 26, 1993
Sold by
Egan William E
Bought by
Mcfarlane Donna J
Create a Home Valuation Report for This Property
The Home Valuation Report is an in-depth analysis detailing your home's value as well as a comparison with similar homes in the area
Home Values in the Area
Average Home Value in this Area
Purchase History
| Date | Buyer | Sale Price | Title Company |
|---|---|---|---|
| Cote Marc A | -- | -- | |
| Cote Marc A | -- | -- | |
| Cote Marc A | $356,000 | -- | |
| Cote Marc A | $356,000 | -- | |
| Krasnow Joshua M | $265,688 | -- | |
| Krasnow Joshua M | $265,688 | -- | |
| Mcfarlane Donna J | $125,000 | -- | |
| Mcfarlane Donna J | $125,000 | -- |
Source: Public Records
Mortgage History
| Date | Status | Borrower | Loan Amount |
|---|---|---|---|
| Previous Owner | Cote Marc A | $345,260 | |
| Previous Owner | Krasnow Joshua M | $212,549 | |
| Previous Owner | Mcfarlane Donna J | $25,000 |
Source: Public Records
Tax History Compared to Growth
Tax History
| Year | Tax Paid | Tax Assessment Tax Assessment Total Assessment is a certain percentage of the fair market value that is determined by local assessors to be the total taxable value of land and additions on the property. | Land | Improvement |
|---|---|---|---|---|
| 2025 | $5,668 | $474,700 | $263,100 | $211,600 |
| 2024 | $5,626 | $451,500 | $235,000 | $216,500 |
| 2023 | $5,312 | $405,800 | $209,700 | $196,100 |
| 2022 | $5,034 | $366,400 | $190,300 | $176,100 |
| 2021 | $4,868 | $346,500 | $182,900 | $163,600 |
| 2020 | $4,880 | $325,800 | $166,200 | $159,600 |
| 2019 | $4,783 | $311,000 | $166,200 | $144,800 |
| 2018 | $4,684 | $287,000 | $160,000 | $127,000 |
| 2017 | $4,624 | $276,700 | $155,400 | $121,300 |
| 2016 | $4,345 | $250,000 | $155,400 | $94,600 |
| 2015 | $4,505 | $252,800 | $155,400 | $97,400 |
Source: Public Records
Map
Nearby Homes
- 145 Beacon St
- 194 Beacon St
- 8 Old Conn Path
- 144 Old Connecticut Path
- 92 Old Connecticut Path
- 109 Hastings St
- 52 Lohnes Rd
- 29 Aberdeen Rd
- 11 Longview Rd
- 33 Highgate Rd
- 4 Mclaughlin St Unit 3
- 15 Haynes Rd
- 27 Joclyn Ave
- 7 Debra Ln
- 12 Bryant Rd
- 30 Donlon St
- 17 Lilian Rd
- 18 Auburn Street Extension
- 171 Walnut St
- 128 Warren Rd