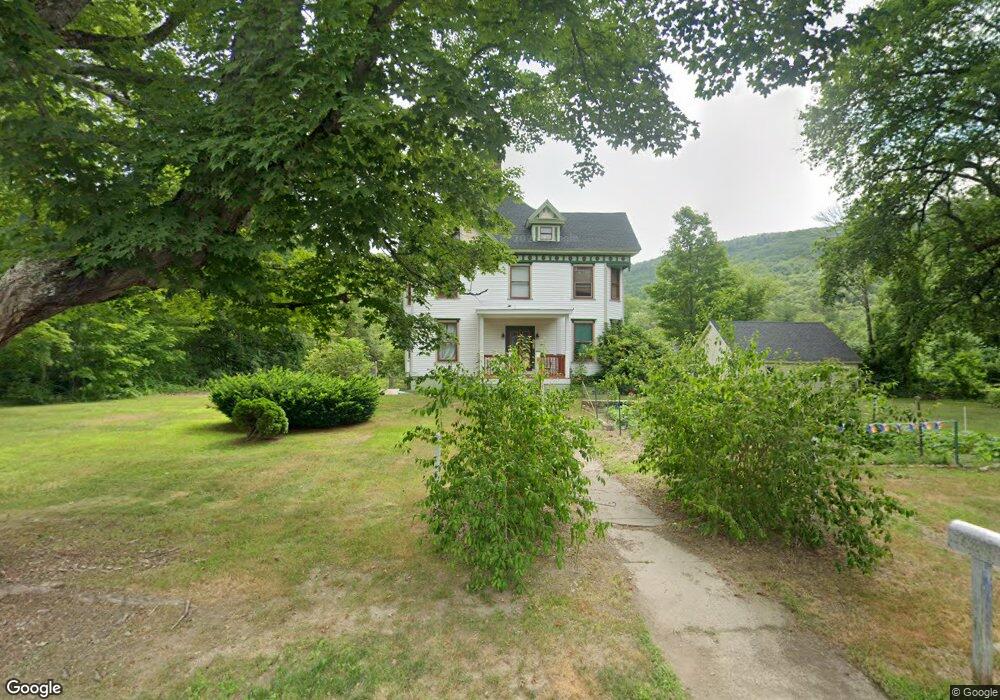
10 Maple Ave Erving, MA 01344
Estimated Value: $402,410 - $436,000
4
Beds
1
Bath
2,396
Sq Ft
$175/Sq Ft
Est. Value
About This Home
This home is located at 10 Maple Ave, Erving, MA 01344 and is currently estimated at $419,803, approximately $175 per square foot. 10 Maple Ave is a home located in Franklin County with nearby schools including Erving Elementary School and Kemsley Academy.
Ownership History
Date
Name
Owned For
Owner Type
Purchase Details
Closed on
Dec 24, 2015
Sold by
Greenfield Sb
Bought by
Dunphy John B
Current Estimated Value
Purchase Details
Closed on
Dec 17, 2015
Sold by
Hanks Penny J and Greenfield Savings Ban
Bought by
Greenfield Savings Ban
Purchase Details
Closed on
Dec 5, 2006
Sold by
Peterson Frank D and Peterson Penny Hanks
Bought by
Peterson Penny Hanks
Purchase Details
Closed on
Jul 30, 1999
Sold by
Keith Donald A and Keith Regina M
Bought by
Peterson Frank D and Hanks-Peterson Penny
Home Financials for this Owner
Home Financials are based on the most recent Mortgage that was taken out on this home.
Original Mortgage
$112,000
Interest Rate
7.61%
Mortgage Type
Purchase Money Mortgage
Create a Home Valuation Report for This Property
The Home Valuation Report is an in-depth analysis detailing your home's value as well as a comparison with similar homes in the area
Home Values in the Area
Average Home Value in this Area
Purchase History
| Date | Buyer | Sale Price | Title Company |
|---|---|---|---|
| Dunphy John B | $150,000 | -- | |
| Greenfield Savings Ban | $156,000 | -- | |
| Peterson Penny Hanks | -- | -- | |
| Peterson Frank D | $118,000 | -- |
Source: Public Records
Mortgage History
| Date | Status | Borrower | Loan Amount |
|---|---|---|---|
| Previous Owner | Peterson Frank D | $29,375 | |
| Previous Owner | Peterson Frank D | $150,000 | |
| Previous Owner | Peterson Frank D | $112,000 |
Source: Public Records
Tax History
| Year | Tax Paid | Tax Assessment Tax Assessment Total Assessment is a certain percentage of the fair market value that is determined by local assessors to be the total taxable value of land and additions on the property. | Land | Improvement |
|---|---|---|---|---|
| 2025 | $3,553 | $381,600 | $81,400 | $300,200 |
| 2024 | $3,420 | $370,900 | $81,400 | $289,500 |
| 2023 | $2,924 | $365,500 | $81,400 | $284,100 |
| 2022 | $2,760 | $349,400 | $81,400 | $268,000 |
| 2021 | $2,570 | $338,600 | $81,400 | $257,200 |
| 2020 | $2,338 | $310,100 | $52,900 | $257,200 |
| 2019 | $2,280 | $310,200 | $52,900 | $257,300 |
| 2018 | $2,219 | $310,400 | $52,900 | $257,500 |
| 2017 | $2,160 | $310,400 | $52,900 | $257,500 |
| 2016 | $2,098 | $310,400 | $52,900 | $257,500 |
| 2015 | $2,557 | $296,600 | $54,800 | $241,800 |
Source: Public Records
Map
Nearby Homes
- 351 Farley Rd
- 0 Old Farley Rd
- 0 State Rd
- 10 W Main St
- 0 State Rd Lot 0
- 0 Four Mile Brook Rd Unit 73462497
- 10 E Prospect St
- 41 Bear Mountain Rd
- 62 E Main St
- Lots 1-4 Kavanaugh Ln
- 270 Wendell Depot Rd
- 0 Wendell Depot Rd
- 18 Crescent St
- 0 French King Hwy
- 44 Moss Brook Rd
- 182 Main Rd
- 30 Stone Valley Rd
- 8 Chester St
- 2 Alice St
- 16 Vladish Ave
Your Personal Tour Guide
Ask me questions while you tour the home.