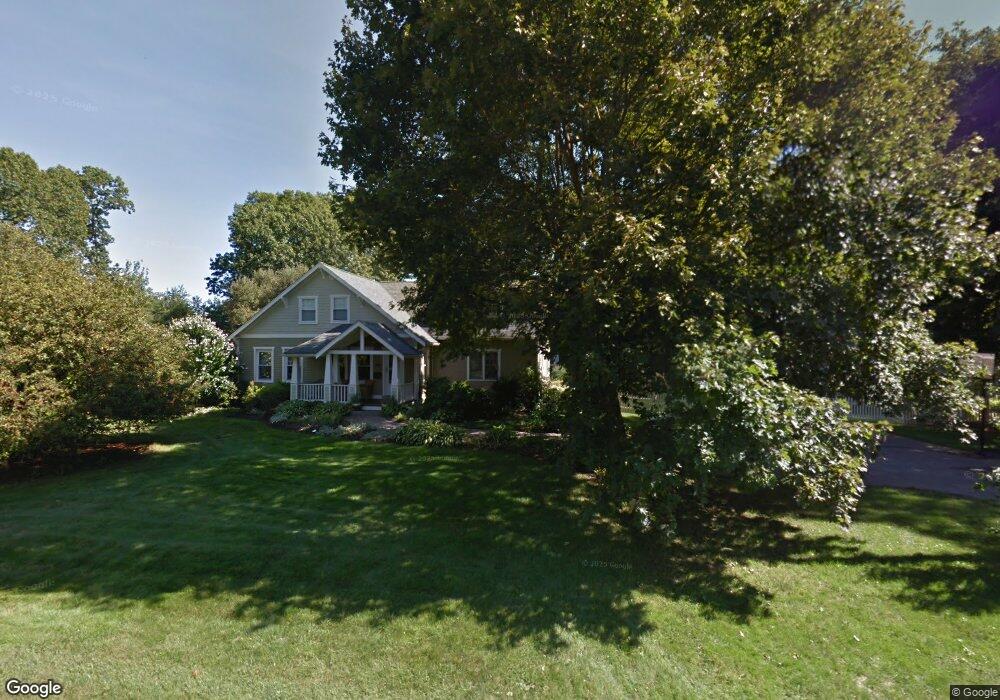
10 Moore St Natick, MA 01760
Estimated Value: $763,000 - $1,503,000
4
Beds
3
Baths
3,273
Sq Ft
$389/Sq Ft
Est. Value
About This Home
This home is located at 10 Moore St, Natick, MA 01760 and is currently estimated at $1,274,450, approximately $389 per square foot. 10 Moore St is a home located in Middlesex County with nearby schools including Natick High School, Johnson Elementary School, and J F Kennedy Middle School.
Ownership History
Date
Name
Owned For
Owner Type
Purchase Details
Closed on
Mar 6, 2025
Sold by
Healy Todd R and Healy Julie J
Bought by
10 Moore Street Rt and Healy
Current Estimated Value
Purchase Details
Closed on
May 31, 2000
Sold by
Looby Peter J and Looby Mary V
Bought by
Healy Todd R and Healy Julie J
Create a Home Valuation Report for This Property
The Home Valuation Report is an in-depth analysis detailing your home's value as well as a comparison with similar homes in the area
Home Values in the Area
Average Home Value in this Area
Purchase History
| Date | Buyer | Sale Price | Title Company |
|---|---|---|---|
| 10 Moore Street Rt | -- | None Available | |
| 10 Moore Street Rt | -- | None Available | |
| Healy Todd R | $275,000 | -- |
Source: Public Records
Mortgage History
| Date | Status | Borrower | Loan Amount |
|---|---|---|---|
| Previous Owner | Healy Todd R | $417,000 | |
| Previous Owner | Healy Todd R | $409,500 |
Source: Public Records
Tax History
| Year | Tax Paid | Tax Assessment Tax Assessment Total Assessment is a certain percentage of the fair market value that is determined by local assessors to be the total taxable value of land and additions on the property. | Land | Improvement |
|---|---|---|---|---|
| 2025 | $14,041 | $1,174,000 | $468,800 | $705,200 |
| 2024 | $13,400 | $1,093,000 | $441,100 | $651,900 |
| 2023 | $13,005 | $1,028,900 | $420,600 | $608,300 |
| 2022 | $12,476 | $935,200 | $378,800 | $556,400 |
| 2021 | $11,945 | $877,700 | $357,100 | $520,600 |
| 2020 | $11,725 | $861,500 | $340,900 | $520,600 |
| 2019 | $10,950 | $861,500 | $340,900 | $520,600 |
| 2018 | $8,293 | $635,500 | $324,700 | $310,800 |
| 2017 | $7,971 | $590,900 | $285,800 | $305,100 |
| 2016 | $7,696 | $567,100 | $264,800 | $302,300 |
| 2015 | $7,488 | $541,800 | $264,800 | $277,000 |
Source: Public Records
Map
Nearby Homes
- 1 Fern St
- 28 Sylvester Rd
- 79 Speen St
- 16 West St
- 62 Oakland St
- 5 Lanes End
- 216-218 S Main St
- 7 Allison Way Unit 7
- 25 Forest Ave
- 11 Morgan Dr Unit 404
- 46 Silver Hill Ln Unit 1
- 89 W Central St
- 5 Reynolds Ave Unit 2
- 36 Silver Hill Ln Unit 21
- 3 Silver Hill Ln Unit 6
- 26 Wellesley Ave Unit B
- 14 Pinewood Ave
- 6 Floral Avenue Extension
- 1 Post Oak Ln Unit 19
- 34 Walden Dr Unit 5
Your Personal Tour Guide
Ask me questions while you tour the home.