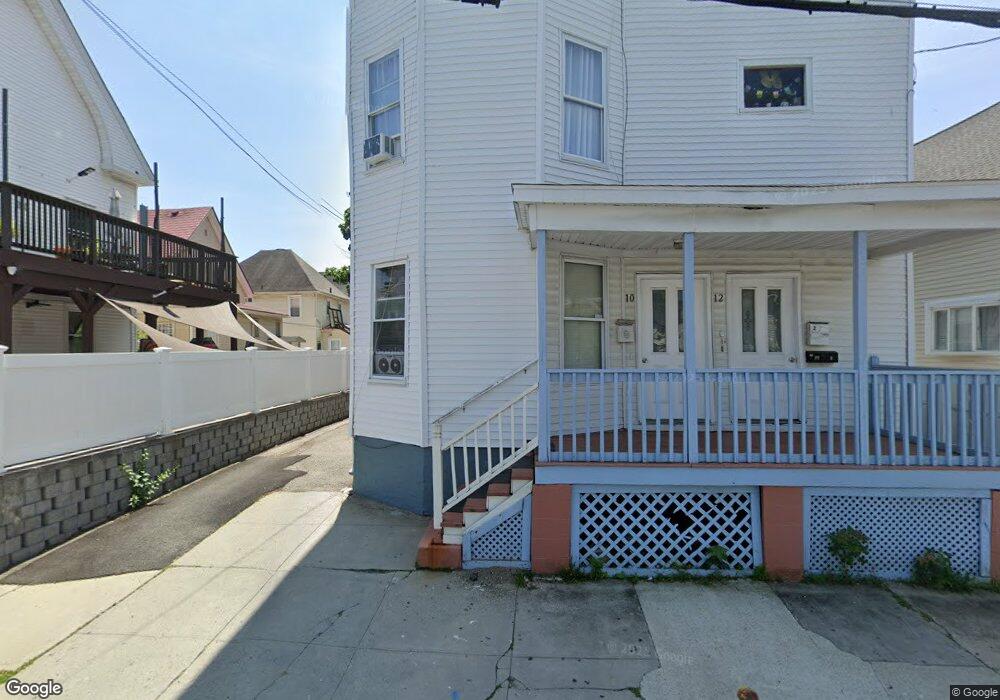
10 Morton St Unit 12 Providence, RI 02905
Washington Park NeighborhoodEstimated Value: $405,609 - $582,000
6
Beds
3
Baths
2,796
Sq Ft
$180/Sq Ft
Est. Value
About This Home
This home is located at 10 Morton St Unit 12, Providence, RI 02905 and is currently estimated at $504,402, approximately $180 per square foot. 10 Morton St Unit 12 is a home located in Providence County with nearby schools including Asa Messer Elementary School, Charles N. Fortes Elementary School, and Alan Shawn Feinstein Elementary.
Ownership History
Date
Name
Owned For
Owner Type
Purchase Details
Closed on
Apr 12, 2017
Sold by
Garcia Maria E
Bought by
Maria E Garcia Ret and Garcia
Current Estimated Value
Purchase Details
Closed on
Nov 6, 2001
Sold by
J & D Inc
Bought by
Garcia Maria E
Purchase Details
Closed on
Jun 14, 1989
Sold by
Schultz Ellen
Bought by
Seymore Arthur L
Create a Home Valuation Report for This Property
The Home Valuation Report is an in-depth analysis detailing your home's value as well as a comparison with similar homes in the area
Home Values in the Area
Average Home Value in this Area
Purchase History
| Date | Buyer | Sale Price | Title Company |
|---|---|---|---|
| Maria E Garcia Ret | -- | -- | |
| Garcia Maria E | $133,000 | -- | |
| Seymore Arthur L | $95,000 | -- | |
| Seymore Arthur L | $95,000 | -- |
Source: Public Records
Mortgage History
| Date | Status | Borrower | Loan Amount |
|---|---|---|---|
| Previous Owner | Seymore Arthur L | $33,614 | |
| Previous Owner | Seymore Arthur L | $306,000 | |
| Previous Owner | Seymore Arthur L | $207,000 |
Source: Public Records
Tax History Compared to Growth
Tax History
| Year | Tax Paid | Tax Assessment Tax Assessment Total Assessment is a certain percentage of the fair market value that is determined by local assessors to be the total taxable value of land and additions on the property. | Land | Improvement |
|---|---|---|---|---|
| 2025 | $3,730 | $494,000 | $118,600 | $375,400 |
| 2024 | $5,980 | $325,900 | $75,100 | $250,800 |
| 2023 | $5,980 | $325,900 | $75,100 | $250,800 |
| 2022 | $4,689 | $325,900 | $75,100 | $250,800 |
| 2021 | $4,689 | $190,900 | $33,100 | $157,800 |
| 2020 | $4,689 | $190,900 | $33,100 | $157,800 |
| 2019 | $4,689 | $190,900 | $33,100 | $157,800 |
| 2018 | $3,851 | $120,500 | $30,100 | $90,400 |
| 2017 | $3,851 | $120,500 | $30,100 | $90,400 |
| 2016 | $3,851 | $120,500 | $30,100 | $90,400 |
| 2015 | $3,327 | $100,500 | $30,100 | $70,400 |
| 2014 | $3,392 | $100,500 | $30,100 | $70,400 |
| 2013 | $3,392 | $100,500 | $30,100 | $70,400 |
Source: Public Records
Map
Nearby Homes