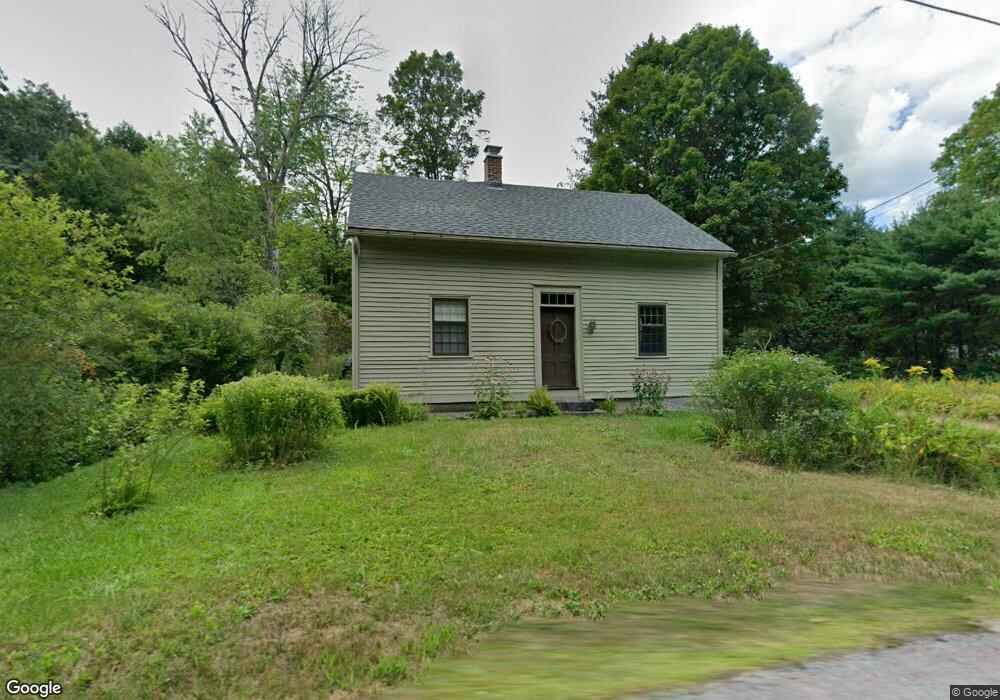
10 Neilson Rd New Salem, MA 01355
New Salem NeighborhoodEstimated Value: $320,385 - $455,000
3
Beds
2
Baths
2,000
Sq Ft
$194/Sq Ft
Est. Value
About This Home
This home is located at 10 Neilson Rd, New Salem, MA 01355 and is currently estimated at $387,346, approximately $193 per square foot. 10 Neilson Rd is a home located in Franklin County with nearby schools including Swift River School and Ralph C Mahar Regional School.
Ownership History
Date
Name
Owned For
Owner Type
Purchase Details
Closed on
May 15, 2015
Sold by
Reita L Oliver Lt
Bought by
Lane William A and Arnold Frances C
Current Estimated Value
Home Financials for this Owner
Home Financials are based on the most recent Mortgage that was taken out on this home.
Original Mortgage
$162,960
Outstanding Balance
$125,584
Interest Rate
3.69%
Mortgage Type
New Conventional
Estimated Equity
$261,762
Create a Home Valuation Report for This Property
The Home Valuation Report is an in-depth analysis detailing your home's value as well as a comparison with similar homes in the area
Home Values in the Area
Average Home Value in this Area
Purchase History
| Date | Buyer | Sale Price | Title Company |
|---|---|---|---|
| Lane William A | $168,000 | -- |
Source: Public Records
Mortgage History
| Date | Status | Borrower | Loan Amount |
|---|---|---|---|
| Open | Lane William A | $162,960 |
Source: Public Records
Tax History Compared to Growth
Tax History
| Year | Tax Paid | Tax Assessment Tax Assessment Total Assessment is a certain percentage of the fair market value that is determined by local assessors to be the total taxable value of land and additions on the property. | Land | Improvement |
|---|---|---|---|---|
| 2025 | $3,204 | $235,900 | $31,300 | $204,600 |
| 2024 | $3,131 | $217,900 | $31,300 | $186,600 |
| 2023 | $3,331 | $217,000 | $37,200 | $179,800 |
| 2022 | $3,655 | $193,200 | $37,200 | $156,000 |
| 2021 | $136 | $177,500 | $33,800 | $143,700 |
| 2020 | $3,202 | $177,500 | $33,800 | $143,700 |
| 2019 | $3,119 | $177,500 | $33,800 | $143,700 |
| 2018 | $3,106 | $171,300 | $32,600 | $138,700 |
| 2017 | $16 | $164,900 | $31,100 | $133,800 |
| 2016 | $2,841 | $164,900 | $31,100 | $133,800 |
| 2015 | $2,426 | $147,200 | $32,200 | $115,000 |
Source: Public Records
Map
Nearby Homes