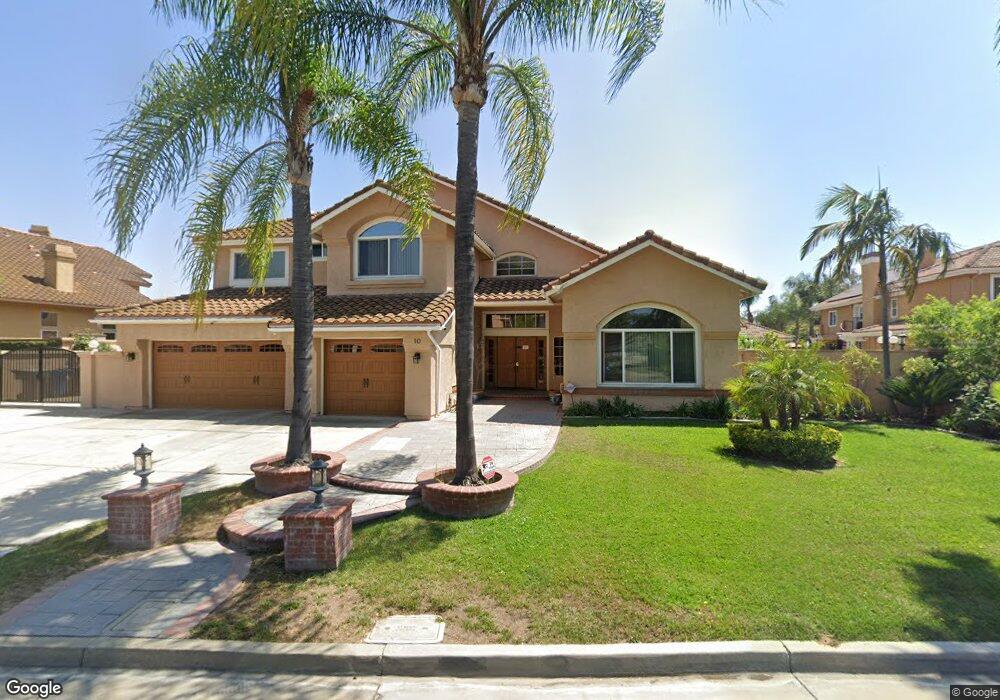
10 Pala Mesa Dr Pomona, CA 91766
Estimated Value: $1,371,000 - $1,550,000
5
Beds
5
Baths
3,820
Sq Ft
$386/Sq Ft
Est. Value
About This Home
This home is located at 10 Pala Mesa Dr, Pomona, CA 91766 and is currently estimated at $1,475,929, approximately $386 per square foot. 10 Pala Mesa Dr is a home located in Los Angeles County with nearby schools including Ranch Hills Elementary, Lorbeer Middle School, and Diamond Ranch High School.
Ownership History
Date
Name
Owned For
Owner Type
Purchase Details
Closed on
Aug 29, 2000
Sold by
Deanda Sally
Bought by
Ko Gordon Y and Ko Wanping
Current Estimated Value
Home Financials for this Owner
Home Financials are based on the most recent Mortgage that was taken out on this home.
Original Mortgage
$252,700
Outstanding Balance
$91,513
Interest Rate
8.01%
Estimated Equity
$1,384,416
Purchase Details
Closed on
May 17, 1995
Sold by
Bank Of America National Tr & Svgs Assn
Bought by
Deanda Sally
Home Financials for this Owner
Home Financials are based on the most recent Mortgage that was taken out on this home.
Original Mortgage
$203,150
Interest Rate
8.37%
Purchase Details
Closed on
Mar 20, 1995
Sold by
Gionis Matthew and Gionis Bessie
Bought by
Bank Of America National Tr & Svgs Assn and The Mbs Certificate Series 1991-2
Home Financials for this Owner
Home Financials are based on the most recent Mortgage that was taken out on this home.
Original Mortgage
$203,150
Interest Rate
8.37%
Create a Home Valuation Report for This Property
The Home Valuation Report is an in-depth analysis detailing your home's value as well as a comparison with similar homes in the area
Home Values in the Area
Average Home Value in this Area
Purchase History
| Date | Buyer | Sale Price | Title Company |
|---|---|---|---|
| Ko Gordon Y | $451,000 | North American Title | |
| Deanda Sally | $305,000 | Old Republic Title | |
| Bank Of America National Tr & Svgs Assn | $242,360 | -- |
Source: Public Records
Mortgage History
| Date | Status | Borrower | Loan Amount |
|---|---|---|---|
| Open | Ko Gordon Y | $252,700 | |
| Previous Owner | Deanda Sally | $203,150 |
Source: Public Records
Tax History Compared to Growth
Tax History
| Year | Tax Paid | Tax Assessment Tax Assessment Total Assessment is a certain percentage of the fair market value that is determined by local assessors to be the total taxable value of land and additions on the property. | Land | Improvement |
|---|---|---|---|---|
| 2025 | $10,254 | $792,313 | $211,551 | $580,762 |
| 2024 | $10,254 | $776,778 | $207,403 | $569,375 |
| 2023 | $10,059 | $761,548 | $203,337 | $558,211 |
| 2022 | $9,912 | $746,616 | $199,350 | $547,266 |
| 2021 | $9,688 | $731,978 | $195,442 | $536,536 |
| 2019 | $9,897 | $710,269 | $189,646 | $520,623 |
| 2018 | $9,053 | $696,343 | $185,928 | $510,415 |
| 2016 | $8,492 | $669,305 | $178,709 | $490,596 |
| 2015 | $8,421 | $659,252 | $176,025 | $483,227 |
| 2014 | $8,362 | $646,339 | $172,577 | $473,762 |
Source: Public Records
Map
Nearby Homes
- 14 Calle Del Cabos
- 18 Calle Del Rodeo
- 15 Ravencrest Cir
- 25 Franciscan Place
- 1 Country Wood Dr
- 49 Stagecoach Dr
- 53 Cottontail Dr
- 32 Franciscan Place
- 30 Country Wood Dr
- 760 Featherwood Dr
- 55 Los Coyotes Dr
- 35 Old Wood Rd
- 46 Country Wood Dr
- 23 Country Ridge Rd
- 51 Rolling Hills Dr
- 15 Greensboro Ct
- 8 Vista Ct
- 54 Falcon Ridge Dr
- 24161 High Knob Rd
- 980 Golden Springs Dr Unit A
- 14 Pala Mesa Dr
- 8 Pala Mesa Dr
- 45 Willowbrook Ln
- 16 Pala Mesa Dr
- 43 Willowbrook Ln
- 11 Pala Mesa Dr
- 47 Willowbrook Ln
- 6 Pala Mesa Dr
- 7 Pala Mesa Dr
- 9 Pala Mesa Dr
- 41 Willowbrook Ln
- 15 Pala Mesa Dr
- 18 Pala Mesa Dr
- 5 Pala Mesa Dr
- 17 Pala Mesa Dr
- 49 Willowbrook Ln
- 39 Willowbrook Ln
- 4 Pala Mesa Dr
- 46 Willowbrook Ln
- 19 Pala Mesa Dr