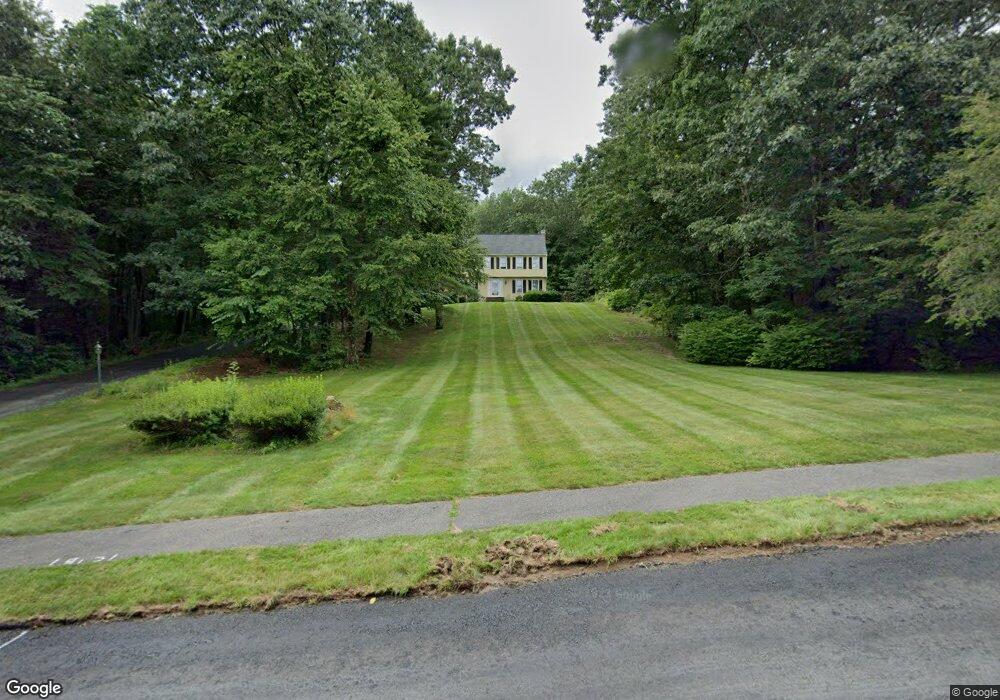
10 Ridge Rd Hopkinton, MA 01748
Estimated Value: $1,011,636 - $1,230,000
4
Beds
3
Baths
2,842
Sq Ft
$396/Sq Ft
Est. Value
About This Home
This home is located at 10 Ridge Rd, Hopkinton, MA 01748 and is currently estimated at $1,125,159, approximately $395 per square foot. 10 Ridge Rd is a home located in Middlesex County with nearby schools including Elmwood Elementary School, Hopkins Elementary School, and Hopkinton Middle School.
Ownership History
Date
Name
Owned For
Owner Type
Purchase Details
Closed on
Sep 3, 2004
Sold by
Heiser Mary E and Heiser Thomas P
Bought by
Cross Christine M and Cross Martin T
Current Estimated Value
Home Financials for this Owner
Home Financials are based on the most recent Mortgage that was taken out on this home.
Original Mortgage
$536,000
Outstanding Balance
$267,848
Interest Rate
6.01%
Mortgage Type
Purchase Money Mortgage
Estimated Equity
$857,311
Create a Home Valuation Report for This Property
The Home Valuation Report is an in-depth analysis detailing your home's value as well as a comparison with similar homes in the area
Home Values in the Area
Average Home Value in this Area
Purchase History
| Date | Buyer | Sale Price | Title Company |
|---|---|---|---|
| Cross Christine M | $670,000 | -- |
Source: Public Records
Mortgage History
| Date | Status | Borrower | Loan Amount |
|---|---|---|---|
| Open | Cross Christine M | $536,000 |
Source: Public Records
Tax History Compared to Growth
Tax History
| Year | Tax Paid | Tax Assessment Tax Assessment Total Assessment is a certain percentage of the fair market value that is determined by local assessors to be the total taxable value of land and additions on the property. | Land | Improvement |
|---|---|---|---|---|
| 2025 | $11,786 | $831,200 | $366,500 | $464,700 |
| 2024 | $11,625 | $795,700 | $349,100 | $446,600 |
| 2023 | $11,483 | $726,300 | $306,800 | $419,500 |
| 2022 | $11,301 | $663,600 | $279,400 | $384,200 |
| 2021 | $10,998 | $643,900 | $271,100 | $372,800 |
| 2020 | $10,518 | $625,300 | $265,000 | $360,300 |
| 2019 | $4,759 | $594,100 | $255,000 | $339,100 |
| 2018 | $4,666 | $573,300 | $243,200 | $330,100 |
| 2017 | $4,331 | $562,300 | $236,500 | $325,800 |
| 2016 | $9,155 | $537,600 | $231,900 | $305,700 |
| 2015 | $9,188 | $511,600 | $225,400 | $286,200 |
Source: Public Records
Map
Nearby Homes
- 3 Whisper Way
- 9 Whisper Way
- 15 Whisper Way
- 208 Wood St
- 17 Whisper Way
- 2 Whisper Way
- 6 Lilac Ct
- 5 Weybridge Ln Unit 5
- 24 Greenwood Rd
- 8 Whalen Rd
- 11 Walcott Valley Dr Unit 11
- 28 Lumber St
- 2 Spring Ln
- 33 W Elm St
- 2 Country Way
- 75 Wilson St
- 68 Spring St
- 9 Highcroft Way Unit 9
- 12 Highcroft Way
- 38 W Elm St