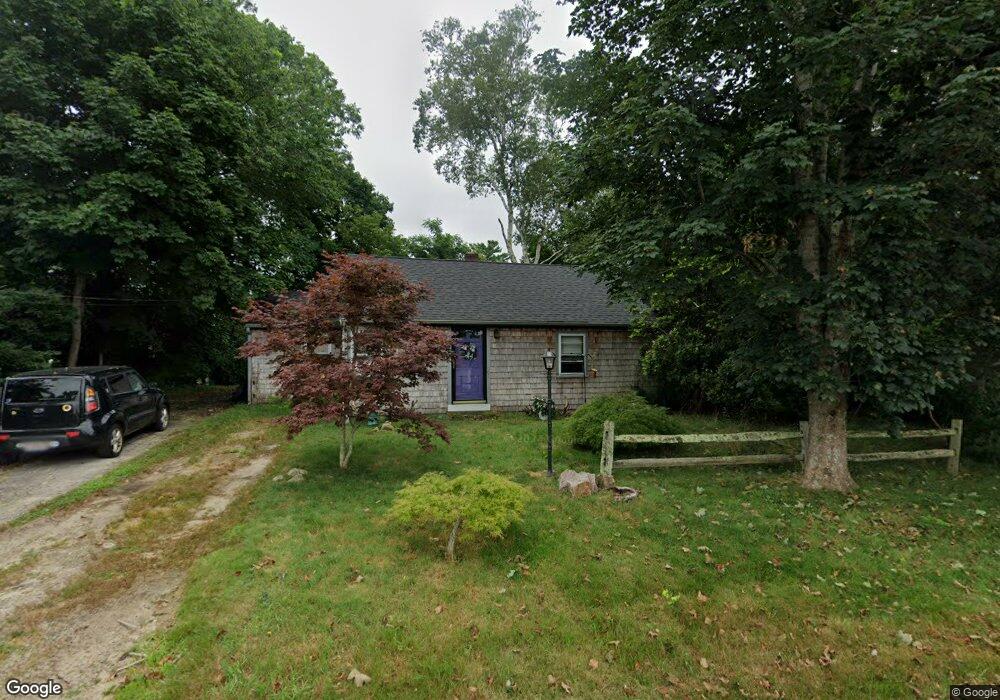
10 River Rd Pocasset, MA 02559
Pocasset NeighborhoodEstimated Value: $501,000 - $618,000
2
Beds
1
Bath
840
Sq Ft
$648/Sq Ft
Est. Value
About This Home
This home is located at 10 River Rd, Pocasset, MA 02559 and is currently estimated at $543,993, approximately $647 per square foot. 10 River Rd is a home located in Barnstable County with nearby schools including Bourne High School, Cadence Academy Preschool - Bourne, and St Margaret Regional School.
Ownership History
Date
Name
Owned For
Owner Type
Purchase Details
Closed on
Mar 31, 2011
Sold by
Patricia C Thoma Rt and Cahir
Bought by
Morrison Duccan A and Vujanovic Ivana
Current Estimated Value
Home Financials for this Owner
Home Financials are based on the most recent Mortgage that was taken out on this home.
Original Mortgage
$127,200
Outstanding Balance
$88,107
Interest Rate
5.04%
Mortgage Type
Purchase Money Mortgage
Estimated Equity
$455,886
Create a Home Valuation Report for This Property
The Home Valuation Report is an in-depth analysis detailing your home's value as well as a comparison with similar homes in the area
Home Values in the Area
Average Home Value in this Area
Purchase History
| Date | Buyer | Sale Price | Title Company |
|---|---|---|---|
| Morrison Duccan A | $159,000 | -- | |
| Morrison Duccan A | $159,000 | -- |
Source: Public Records
Mortgage History
| Date | Status | Borrower | Loan Amount |
|---|---|---|---|
| Open | Morrison Duccan A | $127,200 | |
| Closed | Morrison Duccan A | $127,200 |
Source: Public Records
Tax History
| Year | Tax Paid | Tax Assessment Tax Assessment Total Assessment is a certain percentage of the fair market value that is determined by local assessors to be the total taxable value of land and additions on the property. | Land | Improvement |
|---|---|---|---|---|
| 2025 | $3,464 | $443,500 | $311,700 | $131,800 |
| 2024 | $3,123 | $389,400 | $263,900 | $125,500 |
| 2023 | $3,035 | $344,500 | $233,500 | $111,000 |
| 2022 | $2,257 | $223,700 | $135,600 | $88,100 |
| 2021 | $2,193 | $203,600 | $123,400 | $80,200 |
| 2020 | $2,130 | $198,300 | $122,300 | $76,000 |
| 2019 | $2,039 | $194,000 | $122,300 | $71,700 |
| 2018 | $1,910 | $181,200 | $116,500 | $64,700 |
| 2017 | $1,814 | $176,100 | $115,400 | $60,700 |
| 2016 | $1,639 | $161,300 | $109,900 | $51,400 |
| 2015 | $1,458 | $144,800 | $93,400 | $51,400 |
Source: Public Records
Map
Nearby Homes
Your Personal Tour Guide
Ask me questions while you tour the home.