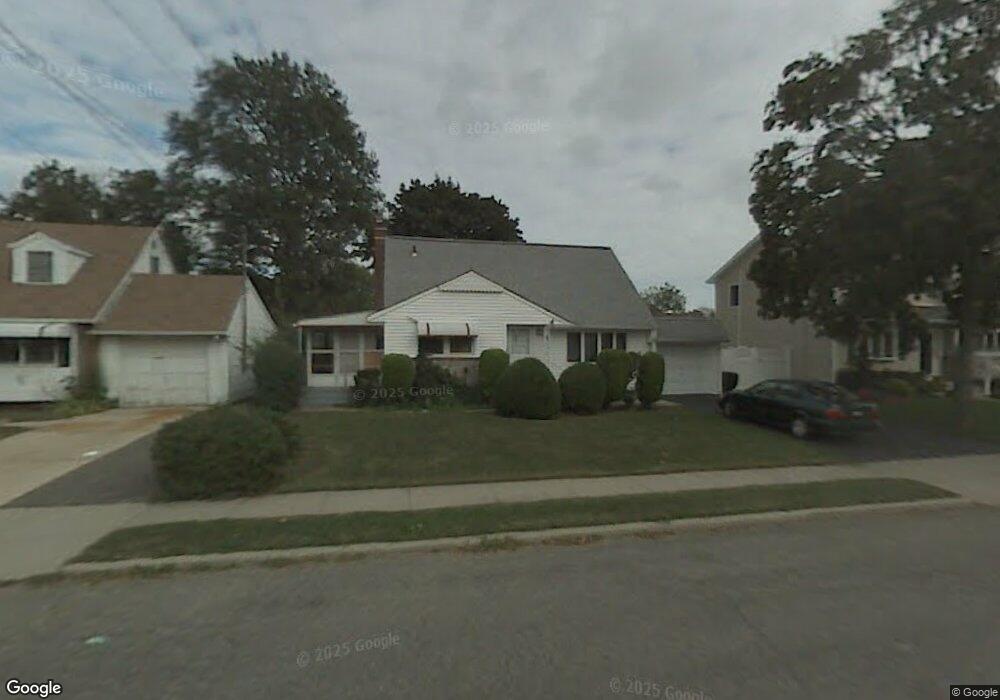
10 S Peach St Bethpage, NY 11714
Estimated Value: $842,088 - $996,000
3
Beds
2
Baths
2,194
Sq Ft
$419/Sq Ft
Est. Value
About This Home
This home is located at 10 S Peach St, Bethpage, NY 11714 and is currently estimated at $919,044, approximately $418 per square foot. 10 S Peach St is a home located in Nassau County with nearby schools including Central Boulevard Elementary School, John F Kennedy Middle School, and Bethpage Senior High School.
Ownership History
Date
Name
Owned For
Owner Type
Purchase Details
Closed on
Sep 2, 2020
Sold by
Iqbal Mohammad Noman and Iqbal Naheed Asma
Bought by
Akrami Nisar A and Noor Maleka
Current Estimated Value
Home Financials for this Owner
Home Financials are based on the most recent Mortgage that was taken out on this home.
Original Mortgage
$510,000
Outstanding Balance
$451,752
Interest Rate
2.8%
Mortgage Type
New Conventional
Estimated Equity
$467,292
Purchase Details
Closed on
Mar 19, 2018
Sold by
Shree Ganeshji Llc
Bought by
Iqbal Mohammad Noman and Iqbal Naheed Asman
Home Financials for this Owner
Home Financials are based on the most recent Mortgage that was taken out on this home.
Original Mortgage
$592,000
Interest Rate
4.38%
Mortgage Type
New Conventional
Purchase Details
Closed on
Nov 9, 2016
Sold by
Oh Jung Myeong and Lee Mi Hyang
Bought by
Shree Ganeshji Llc
Purchase Details
Closed on
Sep 8, 2006
Sold by
Meuschke Frank
Create a Home Valuation Report for This Property
The Home Valuation Report is an in-depth analysis detailing your home's value as well as a comparison with similar homes in the area
Home Values in the Area
Average Home Value in this Area
Purchase History
| Date | Buyer | Sale Price | Title Company |
|---|---|---|---|
| Akrami Nisar A | $600,000 | None Available | |
| Iqbal Mohammad Noman | $744,050 | Judicial Title | |
| Shree Ganeshji Llc | $330,000 | None Available | |
| -- | $390,000 | -- |
Source: Public Records
Mortgage History
| Date | Status | Borrower | Loan Amount |
|---|---|---|---|
| Open | Akrami Nisar A | $510,000 | |
| Previous Owner | Iqbal Mohammad Noman | $592,000 |
Source: Public Records
Tax History Compared to Growth
Tax History
| Year | Tax Paid | Tax Assessment Tax Assessment Total Assessment is a certain percentage of the fair market value that is determined by local assessors to be the total taxable value of land and additions on the property. | Land | Improvement |
|---|---|---|---|---|
| 2025 | $14,177 | $551 | $240 | $311 |
| 2024 | $4,828 | $551 | $240 | $311 |
| 2023 | $12,825 | $567 | $247 | $320 |
| 2022 | $12,825 | $551 | $240 | $311 |
| 2021 | $11,535 | $551 | $240 | $311 |
| 2020 | $14,563 | $589 | $588 | $1 |
| 2019 | $3,355 | $589 | $424 | $165 |
| 2018 | $8,025 | $860 | $0 | $0 |
| 2017 | $8,025 | $860 | $619 | $241 |
| 2016 | $12,444 | $860 | $619 | $241 |
| 2015 | $3,899 | $860 | $619 | $241 |
| 2014 | $3,899 | $860 | $619 | $241 |
| 2013 | $3,535 | $860 | $619 | $241 |
Source: Public Records
Map
Nearby Homes
- 87 Brenner Ave
- 34 Scherer St
- 464 Central Ave
- 328 Martin Place
- 8 Farmedge Rd
- 12 Carson St
- 315 Fern Place
- 4041 Jean Ave
- 472 Farmranch Rd E
- 31 Brenner Ave
- 3723 Fiddler Ln
- 301 Hicksville Rd Unit 8
- 253 Hicksville Rd Unit 2K
- 257 Hicksville Rd Unit 1N
- 234 S Pershing Ave
- 26 Kearney Ave
- 5 Totten St
- 43 Farmedge Rd
- 3680 Stokes Ave
- 30 Acme Ave