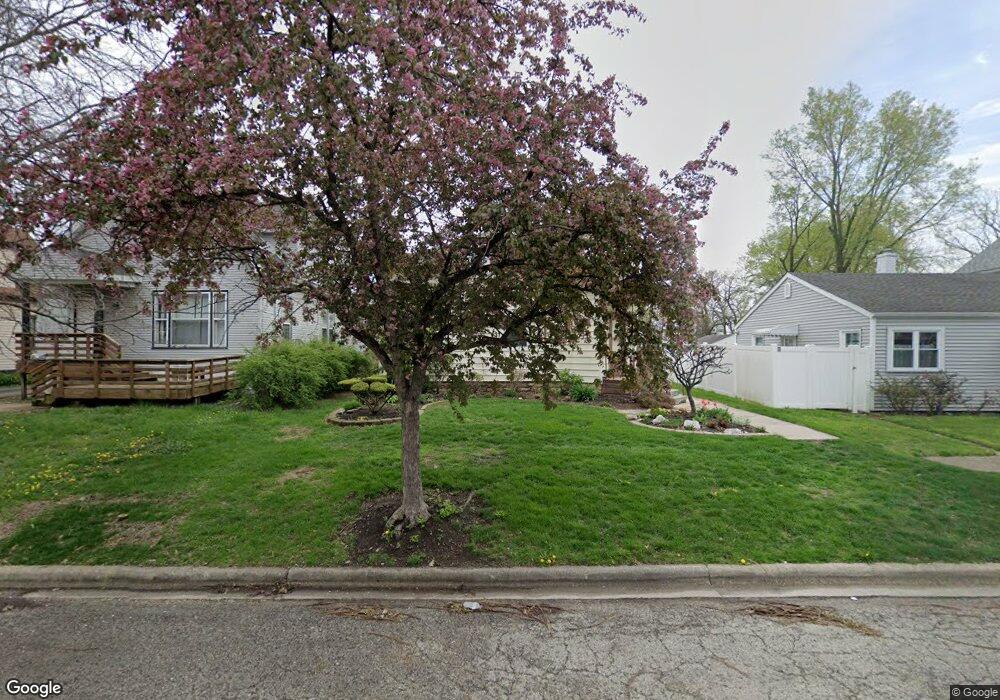
10 Seeser St Joliet, IL 60436
Saint Pat's NeighborhoodEstimated Value: $152,000 - $228,000
3
Beds
--
Bath
944
Sq Ft
$197/Sq Ft
Est. Value
About This Home
This home is located at 10 Seeser St, Joliet, IL 60436 and is currently estimated at $185,519, approximately $196 per square foot. 10 Seeser St is a home located in Will County with nearby schools including Pershing Elementary School, Dirksen Junior High School, and Joliet Central High School.
Ownership History
Date
Name
Owned For
Owner Type
Purchase Details
Closed on
Aug 20, 2003
Sold by
Damian Salomon A and Damian Jose
Bought by
Damian Salomon A
Current Estimated Value
Home Financials for this Owner
Home Financials are based on the most recent Mortgage that was taken out on this home.
Original Mortgage
$67,000
Interest Rate
5.74%
Mortgage Type
New Conventional
Purchase Details
Closed on
Oct 26, 2001
Sold by
Stiles Cynthia M
Bought by
Damian Salomon and Damian Jose
Home Financials for this Owner
Home Financials are based on the most recent Mortgage that was taken out on this home.
Original Mortgage
$69,273
Interest Rate
6.8%
Mortgage Type
FHA
Create a Home Valuation Report for This Property
The Home Valuation Report is an in-depth analysis detailing your home's value as well as a comparison with similar homes in the area
Home Values in the Area
Average Home Value in this Area
Purchase History
| Date | Buyer | Sale Price | Title Company |
|---|---|---|---|
| Damian Salomon A | -- | Lawyers Title Insurance Corp | |
| Damian Salomon | $70,000 | Chicago Title Insurance Co |
Source: Public Records
Mortgage History
| Date | Status | Borrower | Loan Amount |
|---|---|---|---|
| Closed | Damian Salomon A | $67,000 | |
| Closed | Damian Salomon | $69,273 |
Source: Public Records
Tax History Compared to Growth
Tax History
| Year | Tax Paid | Tax Assessment Tax Assessment Total Assessment is a certain percentage of the fair market value that is determined by local assessors to be the total taxable value of land and additions on the property. | Land | Improvement |
|---|---|---|---|---|
| 2024 | $3,038 | $44,269 | $12,089 | $32,180 |
| 2023 | $3,038 | $39,333 | $10,741 | $28,592 |
| 2022 | $2,732 | $35,579 | $9,716 | $25,863 |
| 2021 | $2,559 | $33,229 | $9,074 | $24,155 |
| 2020 | $2,399 | $31,556 | $8,617 | $22,939 |
| 2019 | $2,242 | $29,327 | $8,008 | $21,319 |
| 2018 | $2,020 | $26,273 | $7,166 | $19,107 |
| 2017 | $1,848 | $23,887 | $6,515 | $17,372 |
| 2016 | $1,676 | $21,596 | $5,972 | $15,624 |
| 2015 | $1,571 | $20,250 | $5,600 | $14,650 |
| 2014 | $1,571 | $20,150 | $5,550 | $14,600 |
| 2013 | $1,571 | $22,205 | $6,190 | $16,015 |
Source: Public Records
Map
Nearby Homes