
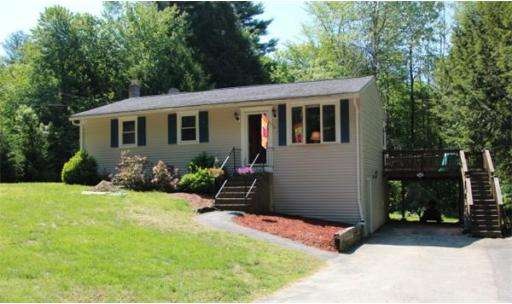

10 Sibley Rd Winchendon, MA 01475
3
Beds
1
Bath
1,200
Sq Ft
0.84
Acres
About This Home
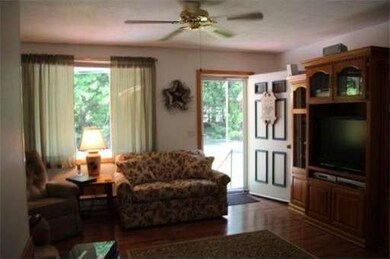
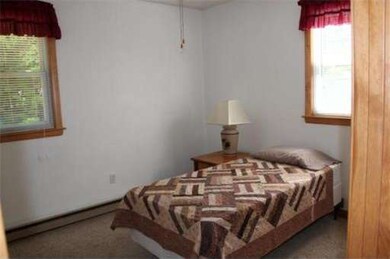
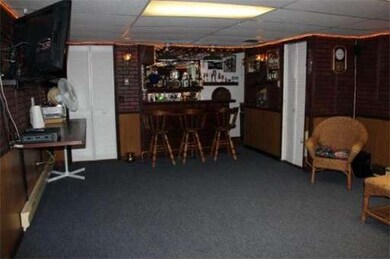
As of November 2017Privacy! Attractive ranch in excellent condition, located on a quiet country road. All appliances to stay. Walk-out finished basement with wet bar. Large wrap-around back deck to enjoy your very private yard. New septic being installed by sellers.
Last Agent to Sell the Property
Cala Claret
RE/MAX Property Promotions License #454500172
Ownership History
Date
Name
Owned For
Owner Type
Purchase Details
Listed on
Sep 21, 2017
Closed on
Nov 6, 2017
Sold by
Roberts Jacob
Bought by
Marion Michelle L
Seller's Agent
Darlene Rossi
Morin Real Estate
Buyer's Agent
Becky LaBelle
Sparks Real Estate
List Price
$175,000
Sold Price
$174,500
Premium/Discount to List
-$500
-0.29%
Total Days on Market
41
Current Estimated Value
Home Financials for this Owner
Home Financials are based on the most recent Mortgage that was taken out on this home.
Estimated Appreciation
$180,155
Avg. Annual Appreciation
9.88%
Purchase Details
Listed on
Jun 3, 2014
Closed on
Sep 5, 2014
Sold by
Searles Marshall L and Searles Veronica N
Bought by
Roberts Jacob
Seller's Agent
Cala Claret
RE/MAX Property Promotions
Buyer's Agent
Nancy Whitehouse-Bain
Keller Williams Realty North Central
List Price
$169,900
Sold Price
$161,000
Premium/Discount to List
-$8,900
-5.24%
Home Financials for this Owner
Home Financials are based on the most recent Mortgage that was taken out on this home.
Avg. Annual Appreciation
2.56%
Original Mortgage
$164,285
Interest Rate
4.12%
Mortgage Type
New Conventional
Map
Home Details
Home Type
Single Family
Est. Annual Taxes
$3,100
Year Built
1976
Lot Details
0
Listing Details
- Lot Description: Wooded, Paved Drive
- Special Features: None
- Property Sub Type: Detached
- Year Built: 1976
Interior Features
- Has Basement: Yes
- Number of Rooms: 5
- Electric: Circuit Breakers, 200 Amps
- Energy: Insulated Windows
- Flooring: Wood, Vinyl, Wall to Wall Carpet
- Insulation: Full
- Interior Amenities: Wetbar
- Basement: Full, Finished, Walk Out
Exterior Features
- Construction: Frame
- Exterior: Vinyl
- Exterior Features: Deck, Hot Tub/Spa
- Foundation: Poured Concrete
Garage/Parking
- Parking: Off-Street
- Parking Spaces: 8
Utilities
- Hot Water: Electric, Leased Heater
- Utility Connections: for Gas Range, for Gas Dryer
Create a Home Valuation Report for This Property
The Home Valuation Report is an in-depth analysis detailing your home's value as well as a comparison with similar homes in the area
Similar Home in Winchendon, MA
Home Values in the Area
Average Home Value in this Area
Purchase History
| Date | Type | Sale Price | Title Company |
|---|---|---|---|
| Not Resolvable | $174,500 | -- | |
| Not Resolvable | $161,000 | -- |
Source: Public Records
Mortgage History
| Date | Status | Loan Amount | Loan Type |
|---|---|---|---|
| Previous Owner | $164,285 | New Conventional | |
| Previous Owner | $10,000 | No Value Available | |
| Previous Owner | $65,000 | No Value Available | |
| Previous Owner | $10,000 | No Value Available | |
| Previous Owner | $64,500 | No Value Available | |
| Previous Owner | $14,976 | No Value Available |
Source: Public Records
Property History
| Date | Event | Price | Change | Sq Ft Price |
|---|---|---|---|---|
| 11/06/2017 11/06/17 | Sold | $174,500 | -0.3% | $130 / Sq Ft |
| 09/29/2017 09/29/17 | Pending | -- | -- | -- |
| 09/21/2017 09/21/17 | For Sale | $175,000 | +8.7% | $130 / Sq Ft |
| 09/04/2014 09/04/14 | Sold | $161,000 | -5.2% | $134 / Sq Ft |
| 07/14/2014 07/14/14 | Pending | -- | -- | -- |
| 07/01/2014 07/01/14 | For Sale | $169,900 | 0.0% | $142 / Sq Ft |
| 06/16/2014 06/16/14 | Pending | -- | -- | -- |
| 06/03/2014 06/03/14 | For Sale | $169,900 | -- | $142 / Sq Ft |
Source: MLS Property Information Network (MLS PIN)
Tax History
| Year | Tax Paid | Tax Assessment Tax Assessment Total Assessment is a certain percentage of the fair market value that is determined by local assessors to be the total taxable value of land and additions on the property. | Land | Improvement |
|---|---|---|---|---|
| 2024 | $3,100 | $247,200 | $41,500 | $205,700 |
| 2023 | $3,032 | $226,300 | $39,400 | $186,900 |
| 2022 | $2,993 | $198,100 | $50,600 | $147,500 |
| 2021 | $2,801 | $178,200 | $44,400 | $133,800 |
| 2020 | $2,745 | $168,600 | $42,300 | $126,300 |
| 2019 | $2,664 | $159,400 | $39,400 | $120,000 |
| 2018 | $2,453 | $141,400 | $36,500 | $104,900 |
| 2017 | $2,352 | $130,900 | $35,700 | $95,200 |
| 2016 | $2,248 | $129,000 | $34,000 | $95,000 |
| 2015 | $1,963 | $117,400 | $34,000 | $83,400 |
| 2014 | $1,853 | $116,100 | $36,000 | $80,100 |
Source: Public Records
Source: MLS Property Information Network (MLS PIN)
MLS Number: 71691784
APN: WINC-000074A-000000-000068
Disclaimer: Certain information contained herein is derived from information provided by parties other than Homes.com. All information provided is deemed reliable, but is not guaranteed to be accurate and should be independently verified.
![]() The property listing data and information, or the Images, set forth herein were provided to MLS Property Information Network, Inc. from third party sources, including sellers, lessors and public records, and were compiled by MLS Property Information Network, Inc. The property listing data and information, and the Images, are for the personal, non-commercial use of consumers having a good faith interest in purchasing or leasing listed properties of the type displayed to them and may not be used for any purpose other than to identify prospective properties which such consumers may have a good faith interest in purchasing or leasing. MLS Property Information Network, Inc. and its subscribers disclaim any and all representations and warranties as to the accuracy of the property listing data and information, or as to the accuracy of any of the Images, set forth herein.
The property listing data and information, or the Images, set forth herein were provided to MLS Property Information Network, Inc. from third party sources, including sellers, lessors and public records, and were compiled by MLS Property Information Network, Inc. The property listing data and information, and the Images, are for the personal, non-commercial use of consumers having a good faith interest in purchasing or leasing listed properties of the type displayed to them and may not be used for any purpose other than to identify prospective properties which such consumers may have a good faith interest in purchasing or leasing. MLS Property Information Network, Inc. and its subscribers disclaim any and all representations and warranties as to the accuracy of the property listing data and information, or as to the accuracy of any of the Images, set forth herein.
Nearby Homes
- 131 Laurel St
- 0 Sibley Rd Unit 73372761
- 40 Hill St
- 49 Kemp St
- 69 Kemp St
- Lot 244 Doyle Ave
- 59 Kemp St
- Lot 14 Baldwinville State Rd
- 691 River St
- 156 Bayberry Cir
- 10-16 Beaman Ct
- 88 West St
- 122 School St
- 105 Oak St
- 179 Front St
- 15 Cottage St
- 20 Joslin Rd
- 234 Baldwinville State Rd
- 177 High St
- 1170-1172 Alger St