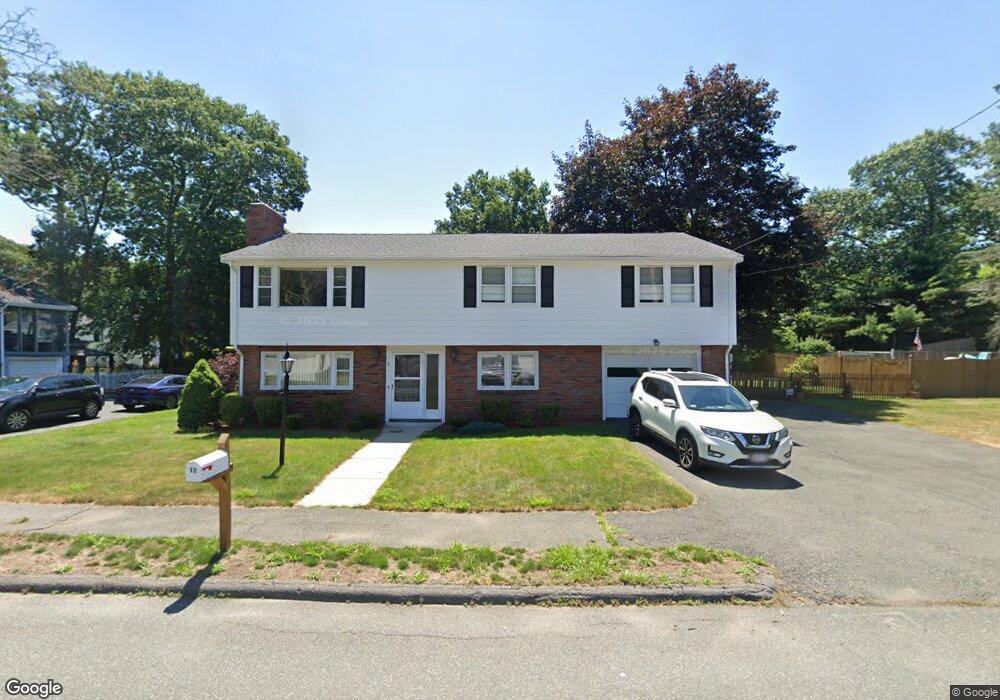
10 Susan Dr Saugus, MA 01906
Lynnhurst NeighborhoodEstimated Value: $749,929 - $868,000
3
Beds
2
Baths
2,455
Sq Ft
$332/Sq Ft
Est. Value
About This Home
This home is located at 10 Susan Dr, Saugus, MA 01906 and is currently estimated at $814,482, approximately $331 per square foot. 10 Susan Dr is a home located in Essex County with nearby schools including Saugus High School and Pioneer Charter School Of Science II.
Ownership History
Date
Name
Owned For
Owner Type
Purchase Details
Closed on
Jul 20, 2023
Sold by
Stockwell Grant C and Stockwell Paula
Bought by
Stockwell Paula
Current Estimated Value
Home Financials for this Owner
Home Financials are based on the most recent Mortgage that was taken out on this home.
Original Mortgage
$340,000
Outstanding Balance
$330,975
Interest Rate
6.43%
Mortgage Type
Purchase Money Mortgage
Estimated Equity
$483,507
Purchase Details
Closed on
Jun 13, 2023
Sold by
Solimine T Corp
Bought by
Stockwell Grant C and Stockwell Paula
Home Financials for this Owner
Home Financials are based on the most recent Mortgage that was taken out on this home.
Original Mortgage
$340,000
Outstanding Balance
$330,975
Interest Rate
6.43%
Mortgage Type
Purchase Money Mortgage
Estimated Equity
$483,507
Purchase Details
Closed on
Feb 10, 2009
Sold by
Reppucci Gerald J
Bought by
Reppucci Ft
Create a Home Valuation Report for This Property
The Home Valuation Report is an in-depth analysis detailing your home's value as well as a comparison with similar homes in the area
Home Values in the Area
Average Home Value in this Area
Purchase History
| Date | Buyer | Sale Price | Title Company |
|---|---|---|---|
| Stockwell Paula | -- | None Available | |
| Stockwell Grant C | $675,000 | None Available | |
| Reppucci Ft | -- | -- |
Source: Public Records
Mortgage History
| Date | Status | Borrower | Loan Amount |
|---|---|---|---|
| Open | Stockwell Grant C | $340,000 | |
| Previous Owner | Reppucci Ft | $25,000 |
Source: Public Records
Tax History Compared to Growth
Tax History
| Year | Tax Paid | Tax Assessment Tax Assessment Total Assessment is a certain percentage of the fair market value that is determined by local assessors to be the total taxable value of land and additions on the property. | Land | Improvement |
|---|---|---|---|---|
| 2025 | $6,111 | $572,200 | $284,400 | $287,800 |
| 2024 | $5,918 | $555,700 | $273,600 | $282,100 |
| 2023 | $5,839 | $518,600 | $248,400 | $270,200 |
| 2022 | $5,711 | $475,500 | $226,100 | $249,400 |
| 2021 | $5,457 | $442,200 | $196,600 | $245,600 |
| 2020 | $5,157 | $432,600 | $196,600 | $236,000 |
| 2019 | $5,045 | $414,200 | $187,200 | $227,000 |
| 2018 | $4,585 | $395,900 | $177,800 | $218,100 |
| 2017 | $4,398 | $365,000 | $169,200 | $195,800 |
| 2016 | $4,414 | $361,800 | $162,100 | $199,700 |
| 2015 | $4,142 | $344,600 | $154,300 | $190,300 |
| 2014 | $3,913 | $337,000 | $154,300 | $182,700 |
Source: Public Records
Map
Nearby Homes