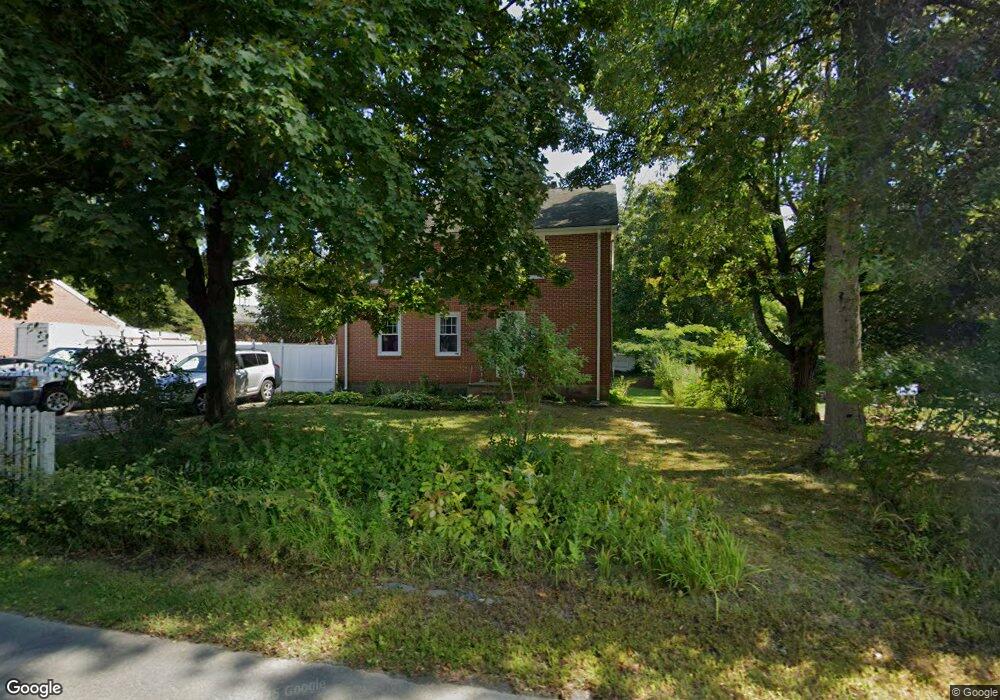
10 Townsend St Pepperell, MA 01463
Estimated Value: $457,000 - $628,000
3
Beds
2
Baths
2,443
Sq Ft
$229/Sq Ft
Est. Value
About This Home
This home is located at 10 Townsend St, Pepperell, MA 01463 and is currently estimated at $558,382, approximately $228 per square foot. 10 Townsend St is a home located in Middlesex County with nearby schools including North Middlesex Regional High School, Pepperell Christian Academy, and Maple Dene & Moppet School.
Ownership History
Date
Name
Owned For
Owner Type
Purchase Details
Closed on
Mar 2, 2010
Sold by
Fraser Ramona L
Bought by
Harney Richard E
Current Estimated Value
Home Financials for this Owner
Home Financials are based on the most recent Mortgage that was taken out on this home.
Original Mortgage
$100,000
Outstanding Balance
$66,707
Interest Rate
5.11%
Estimated Equity
$491,675
Purchase Details
Closed on
Aug 12, 2009
Sold by
Harney Gregory A and Harney Richard E
Bought by
Harney Richard E and Fraser Ramona L
Home Financials for this Owner
Home Financials are based on the most recent Mortgage that was taken out on this home.
Original Mortgage
$35,000
Interest Rate
5.36%
Mortgage Type
Purchase Money Mortgage
Create a Home Valuation Report for This Property
The Home Valuation Report is an in-depth analysis detailing your home's value as well as a comparison with similar homes in the area
Home Values in the Area
Average Home Value in this Area
Purchase History
| Date | Buyer | Sale Price | Title Company |
|---|---|---|---|
| Harney Richard E | -- | -- | |
| Harney Richard E | $70,000 | -- |
Source: Public Records
Mortgage History
| Date | Status | Borrower | Loan Amount |
|---|---|---|---|
| Open | Harney Richard E | $100,000 | |
| Previous Owner | Harney Richard E | $35,000 |
Source: Public Records
Tax History Compared to Growth
Tax History
| Year | Tax Paid | Tax Assessment Tax Assessment Total Assessment is a certain percentage of the fair market value that is determined by local assessors to be the total taxable value of land and additions on the property. | Land | Improvement |
|---|---|---|---|---|
| 2025 | $6,257 | $427,700 | $145,100 | $282,600 |
| 2024 | $5,716 | $398,300 | $133,300 | $265,000 |
| 2023 | $5,450 | $360,000 | $112,500 | $247,500 |
| 2022 | $5,092 | $296,900 | $88,800 | $208,100 |
| 2021 | $4,910 | $274,000 | $77,000 | $197,000 |
| 2020 | $12,353 | $277,500 | $77,000 | $200,500 |
| 2019 | $4,252 | $256,300 | $77,000 | $179,300 |
| 2018 | $0 | $245,600 | $77,000 | $168,600 |
| 2017 | $3,612 | $227,300 | $71,100 | $156,200 |
| 2016 | $3,504 | $212,000 | $71,100 | $140,900 |
| 2015 | $3,381 | $212,000 | $71,100 | $140,900 |
| 2014 | $3,348 | $211,100 | $77,000 | $134,100 |
Source: Public Records
Map
Nearby Homes
- 31 Heald St
- 6 Mason St Unit 31
- 55 Park St
- 10 Tucker St
- 35 Hollis St Unit 1
- 38 River Rd Unit 11
- 4 Parker Hill Way Unit C
- 31 Prospect St
- 28-30 Groton St
- 18 Maple St Unit 14
- 18 Maple St Unit 30
- 7 Birch Hill Rd
- 9 Tarbell St
- 120 Townsend St Unit 1
- 38 Tarbell St Unit 5B
- 7 Maureens Way
- 10 Boynton St
- 142 River Rd
- 154 Townsend St
- 179 Brookline St