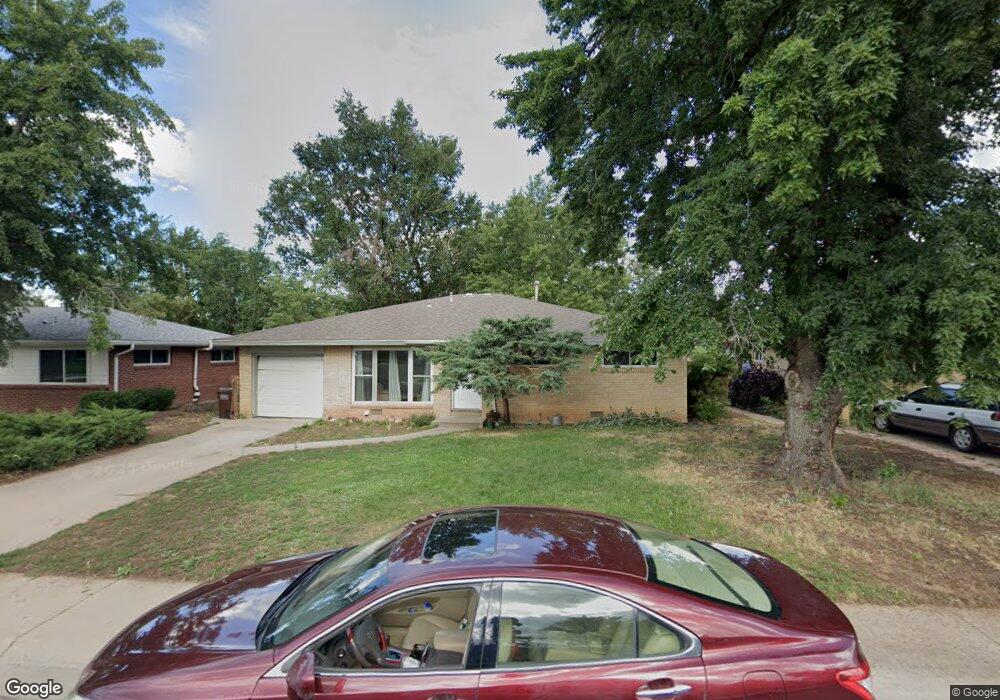
100 31st St Boulder, CO 80305
South Boulder NeighborhoodEstimated Value: $866,000 - $1,212,000
5
Beds
2
Baths
2,394
Sq Ft
$435/Sq Ft
Est. Value
About This Home
This home is located at 100 31st St, Boulder, CO 80305 and is currently estimated at $1,041,317, approximately $434 per square foot. 100 31st St is a home located in Boulder County with nearby schools including Creekside Elementary School, Manhattan Middle School of the Arts & Academics, and Fairview High School.
Ownership History
Date
Name
Owned For
Owner Type
Purchase Details
Closed on
Dec 1, 2019
Sold by
Kulikowski Robert
Bought by
100 S 31St Llc
Current Estimated Value
Purchase Details
Closed on
Jul 8, 2008
Sold by
Somers Jason
Bought by
Kulikouski Robert
Purchase Details
Closed on
Jun 17, 2004
Sold by
Welch Donald O
Bought by
Lansing Teneyck
Home Financials for this Owner
Home Financials are based on the most recent Mortgage that was taken out on this home.
Original Mortgage
$277,400
Interest Rate
6.12%
Mortgage Type
Unknown
Purchase Details
Closed on
Jul 9, 1976
Bought by
Kulikowski Robert
Create a Home Valuation Report for This Property
The Home Valuation Report is an in-depth analysis detailing your home's value as well as a comparison with similar homes in the area
Home Values in the Area
Average Home Value in this Area
Purchase History
| Date | Buyer | Sale Price | Title Company |
|---|---|---|---|
| 100 S 31St Llc | -- | Heritage Title Co | |
| Kulikouski Robert | $335,000 | Vista Title Llc | |
| Somers Jason | $319,719 | Vista Title Llc | |
| Lansing Teneyck | $346,750 | First Colorado Title | |
| Kulikowski Robert | $35,200 | -- |
Source: Public Records
Mortgage History
| Date | Status | Borrower | Loan Amount |
|---|---|---|---|
| Previous Owner | Lansing Teneyck | $277,400 | |
| Closed | Lansing Teneyck | $69,350 |
Source: Public Records
Tax History
| Year | Tax Paid | Tax Assessment Tax Assessment Total Assessment is a certain percentage of the fair market value that is determined by local assessors to be the total taxable value of land and additions on the property. | Land | Improvement |
|---|---|---|---|---|
| 2025 | $6,646 | $68,288 | $29,950 | $38,338 |
| 2024 | $6,646 | $68,288 | $29,950 | $38,338 |
| 2023 | $6,528 | $74,725 | $35,229 | $43,182 |
| 2022 | $5,683 | $60,389 | $26,681 | $33,708 |
| 2021 | $5,423 | $62,127 | $27,449 | $34,678 |
| 2020 | $4,974 | $57,143 | $26,455 | $30,688 |
| 2019 | $4,898 | $57,143 | $26,455 | $30,688 |
| 2018 | $4,466 | $51,516 | $24,336 | $27,180 |
| 2017 | $4,327 | $56,954 | $26,905 | $30,049 |
| 2016 | $3,653 | $42,204 | $16,955 | $25,249 |
| 2015 | $3,460 | $30,176 | $15,442 | $14,734 |
| 2014 | $2,537 | $30,176 | $15,442 | $14,734 |
Source: Public Records
Map
Nearby Homes
- 3000 Dartmouth Ave
- 2955 Stanford Ave
- 2585 Kohler Dr
- 345 S 38th St
- 2795 Vassar Dr
- 3805 Martin Dr
- 210 S 39th St
- 2250 Bluebell Ave
- 2235 Vassar Dr
- 245 Fair Place
- 450 S 41st St
- 2221 Columbine Ave
- 370 20th St
- 805 29th St Unit 253
- 805 29th St Unit 157
- 805 29th St Unit 402
- 805 29th St Unit 404
- 2032 Mariposa Ave
- 1965 Kohler Dr
- 780 33rd St
Your Personal Tour Guide
Ask me questions while you tour the home.