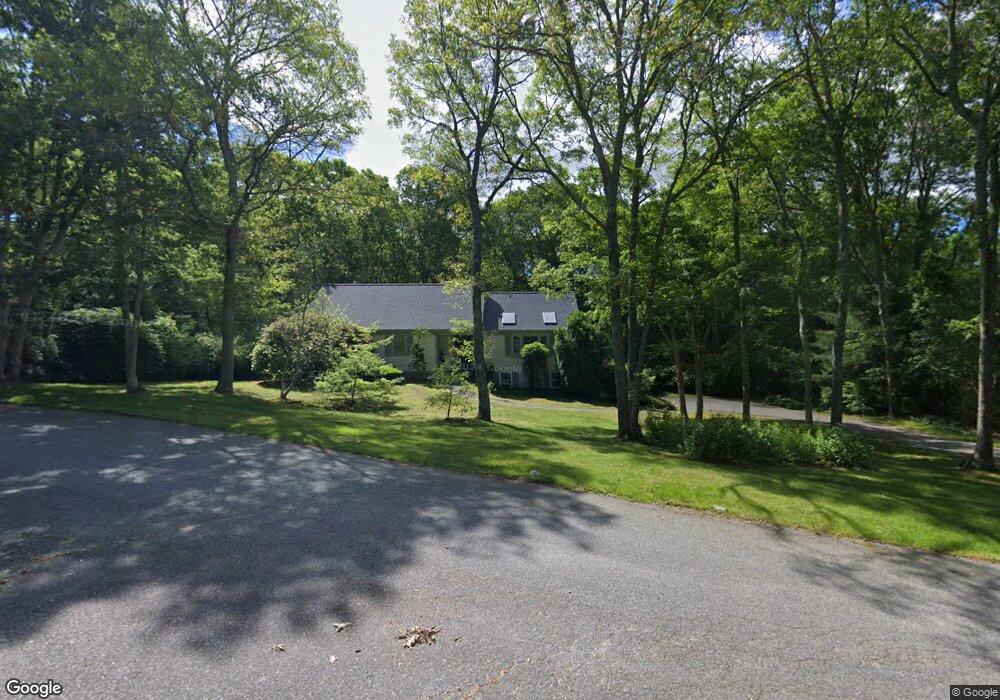
100 Allan Rd West Barnstable, MA 02668
West Barnstable NeighborhoodEstimated Value: $668,482 - $897,000
3
Beds
2
Baths
1,591
Sq Ft
$485/Sq Ft
Est. Value
About This Home
This home is located at 100 Allan Rd, West Barnstable, MA 02668 and is currently estimated at $771,371, approximately $484 per square foot. 100 Allan Rd is a home located in Barnstable County with nearby schools including Barnstable United Elementary School, West Barnstable Elementary School, and Barnstable Intermediate School.
Ownership History
Date
Name
Owned For
Owner Type
Purchase Details
Closed on
Sep 15, 2025
Sold by
Lucille T Perodeau T T and Lucille Leger
Bought by
Westcott Prop Mgmt Llc
Current Estimated Value
Purchase Details
Closed on
Jun 14, 1993
Sold by
Herron Robert H and Herron Marjorie N
Bought by
Perodeau Alfred A and Perodeau Lucille T
Home Financials for this Owner
Home Financials are based on the most recent Mortgage that was taken out on this home.
Original Mortgage
$100,000
Interest Rate
7.41%
Mortgage Type
Purchase Money Mortgage
Create a Home Valuation Report for This Property
The Home Valuation Report is an in-depth analysis detailing your home's value as well as a comparison with similar homes in the area
Home Values in the Area
Average Home Value in this Area
Purchase History
| Date | Buyer | Sale Price | Title Company |
|---|---|---|---|
| Westcott Prop Mgmt Llc | $600,000 | -- | |
| Perodeau Alfred A | $161,500 | -- |
Source: Public Records
Mortgage History
| Date | Status | Borrower | Loan Amount |
|---|---|---|---|
| Previous Owner | Perodeau Alfred A | $100,000 |
Source: Public Records
Tax History Compared to Growth
Tax History
| Year | Tax Paid | Tax Assessment Tax Assessment Total Assessment is a certain percentage of the fair market value that is determined by local assessors to be the total taxable value of land and additions on the property. | Land | Improvement |
|---|---|---|---|---|
| 2025 | $5,199 | $642,600 | $176,400 | $466,200 |
| 2024 | $4,981 | $637,800 | $176,400 | $461,400 |
| 2023 | $4,632 | $555,400 | $160,400 | $395,000 |
| 2022 | $4,412 | $457,700 | $118,900 | $338,800 |
| 2021 | $4,138 | $394,500 | $118,900 | $275,600 |
| 2020 | $4,263 | $389,000 | $126,800 | $262,200 |
| 2019 | $4,042 | $358,300 | $126,800 | $231,500 |
| 2018 | $3,638 | $324,200 | $133,400 | $190,800 |
| 2017 | $3,388 | $314,900 | $133,400 | $181,500 |
| 2016 | $3,472 | $318,500 | $137,000 | $181,500 |
| 2015 | $3,214 | $296,200 | $127,100 | $169,100 |
Source: Public Records
Map
Nearby Homes
- 62 Three Ponds Dr
- 900 Old Stage Rd
- 66 Tern Ln
- 88 Joe Thompson Rd
- 74 Saddler Ln
- 50 Currycomb Cir
- 1044 Old Falmouth Rd
- 1028 Old Falmouth Rd
- 282 Parker Rd
- 87 Foxglove Rd
- 296 Buckskin Path
- 315 Prince Hinckley Rd
- 1825 Main St
- 81 Monomoy Cir
- 55 Chickadee Ln
- 22 Cranberry Ln
- 21 Shannon Way
- 205 James Otis Rd
- 16 Bridgets Path
- 58 Loomis Ln