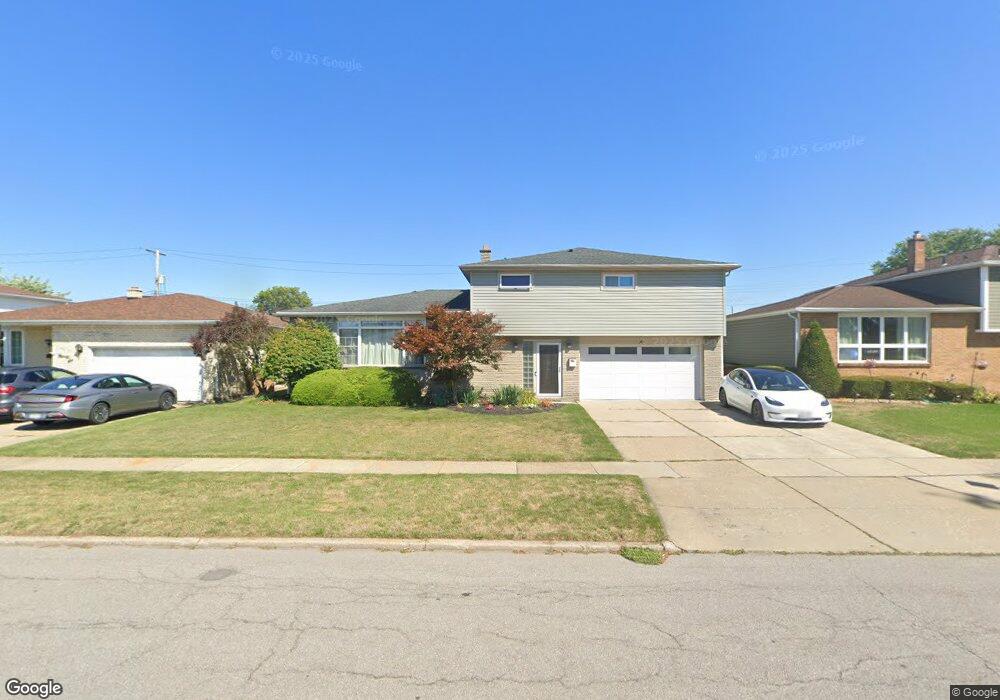
100 Bernice Dr Cheektowaga, NY 14225
Central Cheektowaga NeighborhoodEstimated Value: $324,649 - $378,000
4
Beds
2
Baths
2,310
Sq Ft
$153/Sq Ft
Est. Value
About This Home
This home is located at 100 Bernice Dr, Cheektowaga, NY 14225 and is currently estimated at $354,162, approximately $153 per square foot. 100 Bernice Dr is a home located in Erie County with nearby schools including Maryvale Primary School, Maryvale Intermediate School, and Maryvale Middle School.
Ownership History
Date
Name
Owned For
Owner Type
Purchase Details
Closed on
Jul 17, 2007
Sold by
Fetes Earl G and Fetes Mary A
Bought by
Tran Thomas T and Tran Dunia A
Current Estimated Value
Home Financials for this Owner
Home Financials are based on the most recent Mortgage that was taken out on this home.
Original Mortgage
$108,000
Outstanding Balance
$68,310
Interest Rate
6.73%
Mortgage Type
Purchase Money Mortgage
Estimated Equity
$285,852
Purchase Details
Closed on
Jun 13, 2007
Sold by
Oconnor Christine A and Fetes James P
Bought by
Fetes Earl G and Fetes Mary A
Home Financials for this Owner
Home Financials are based on the most recent Mortgage that was taken out on this home.
Original Mortgage
$108,000
Outstanding Balance
$68,310
Interest Rate
6.73%
Mortgage Type
Purchase Money Mortgage
Estimated Equity
$285,852
Purchase Details
Closed on
Oct 27, 2005
Sold by
Fetes Earl G and Fetes Mary A
Bought by
Fetes Earl G and Fetes Mary A
Create a Home Valuation Report for This Property
The Home Valuation Report is an in-depth analysis detailing your home's value as well as a comparison with similar homes in the area
Home Values in the Area
Average Home Value in this Area
Purchase History
| Date | Buyer | Sale Price | Title Company |
|---|---|---|---|
| Tran Thomas T | $135,000 | First Amer Title Ins Co Ny | |
| Fetes Earl G | -- | None Available | |
| Fetes Earl G | -- | None Available |
Source: Public Records
Mortgage History
| Date | Status | Borrower | Loan Amount |
|---|---|---|---|
| Open | Tran Thomas T | $108,000 |
Source: Public Records
Tax History
| Year | Tax Paid | Tax Assessment Tax Assessment Total Assessment is a certain percentage of the fair market value that is determined by local assessors to be the total taxable value of land and additions on the property. | Land | Improvement |
|---|---|---|---|---|
| 2024 | $7,314 | $237,000 | $17,000 | $220,000 |
| 2023 | $7,038 | $237,000 | $17,000 | $220,000 |
| 2022 | $6,851 | $237,000 | $17,000 | $220,000 |
| 2021 | $6,640 | $206,000 | $17,000 | $189,000 |
| 2020 | $5,899 | $149,700 | $14,000 | $135,700 |
| 2019 | $5,013 | $149,700 | $14,000 | $135,700 |
| 2018 | $5,533 | $149,700 | $14,000 | $135,700 |
| 2017 | $3,048 | $149,700 | $14,000 | $135,700 |
| 2016 | $4,964 | $138,100 | $14,000 | $124,100 |
| 2015 | -- | $138,100 | $14,000 | $124,100 |
| 2014 | -- | $138,100 | $14,000 | $124,100 |
Source: Public Records
Map
Nearby Homes
- 36 Angela Ln
- 3 Honduras Ln
- 56 Bahama Ln
- 1370 George Urban Blvd
- 1290 George Urban Blvd
- 247 Nagel Dr
- 275 Nagel Dr
- 11 Wellington Rd
- 57 Karen Ln
- 43 Barone Cir
- 47 Temple Dr
- 203 Lydia Ln
- 85 Poinciana Pkwy
- 35 Crandon Blvd
- 119 Northcrest Ave
- 178 Chapel Ave
- 70 Crandon Blvd
- 18 Fath Dr
- 68 Chapel Ave
- 208 Poinciana Pkwy
Your Personal Tour Guide
Ask me questions while you tour the home.