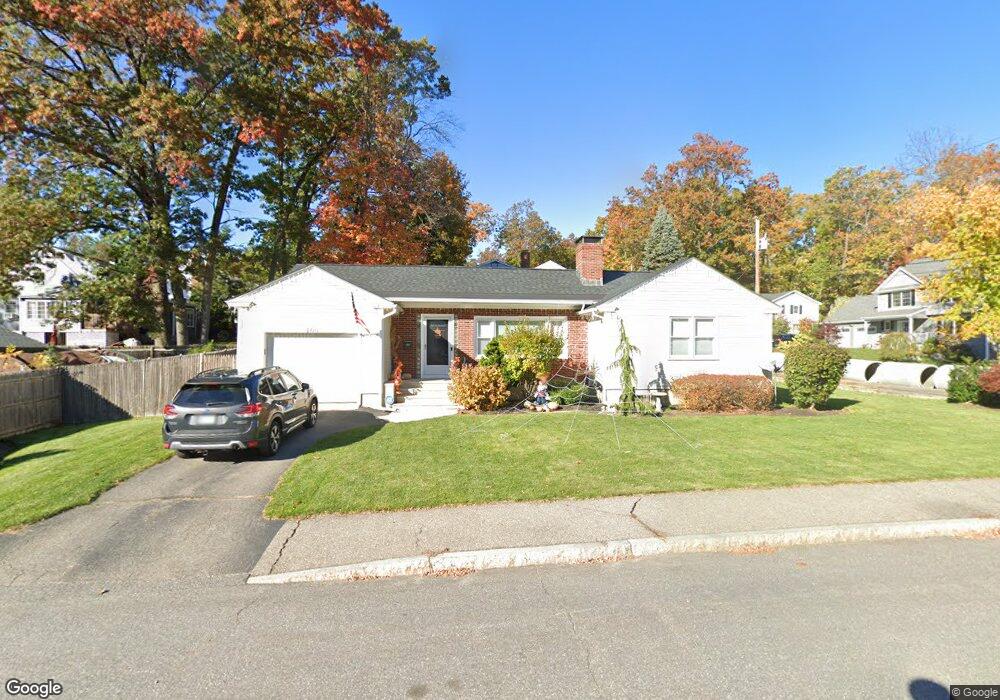
100 Carnegie St Manchester, NH 03104
Straw-Smyth NeighborhoodEstimated Value: $472,414 - $518,000
2
Beds
1
Bath
1,336
Sq Ft
$369/Sq Ft
Est. Value
About This Home
This home is located at 100 Carnegie St, Manchester, NH 03104 and is currently estimated at $492,854, approximately $368 per square foot. 100 Carnegie St is a home located in Hillsborough County with nearby schools including Smyth Road School, Hillside Middle School, and Manchester Central High School.
Ownership History
Date
Name
Owned For
Owner Type
Purchase Details
Closed on
Aug 27, 2010
Sold by
Janet Kolkebeck T
Bought by
Huot Timothy S and Huot Aura M
Current Estimated Value
Home Financials for this Owner
Home Financials are based on the most recent Mortgage that was taken out on this home.
Original Mortgage
$224,871
Outstanding Balance
$149,466
Interest Rate
4.57%
Mortgage Type
Purchase Money Mortgage
Estimated Equity
$343,388
Purchase Details
Closed on
Apr 21, 2005
Sold by
Struck Mildred
Bought by
Koklebeck Janet
Home Financials for this Owner
Home Financials are based on the most recent Mortgage that was taken out on this home.
Original Mortgage
$106,500
Interest Rate
5.87%
Mortgage Type
Purchase Money Mortgage
Create a Home Valuation Report for This Property
The Home Valuation Report is an in-depth analysis detailing your home's value as well as a comparison with similar homes in the area
Home Values in the Area
Average Home Value in this Area
Purchase History
| Date | Buyer | Sale Price | Title Company |
|---|---|---|---|
| Huot Timothy S | $227,900 | -- | |
| Koklebeck Janet | $256,500 | -- |
Source: Public Records
Mortgage History
| Date | Status | Borrower | Loan Amount |
|---|---|---|---|
| Open | Koklebeck Janet | $224,871 | |
| Previous Owner | Koklebeck Janet | $97,000 | |
| Previous Owner | Koklebeck Janet | $16,000 | |
| Previous Owner | Koklebeck Janet | $106,500 |
Source: Public Records
Tax History Compared to Growth
Tax History
| Year | Tax Paid | Tax Assessment Tax Assessment Total Assessment is a certain percentage of the fair market value that is determined by local assessors to be the total taxable value of land and additions on the property. | Land | Improvement |
|---|---|---|---|---|
| 2024 | $6,285 | $321,000 | $114,500 | $206,500 |
| 2023 | $6,054 | $321,000 | $114,500 | $206,500 |
| 2022 | $5,855 | $321,000 | $114,500 | $206,500 |
| 2021 | $5,675 | $321,000 | $114,500 | $206,500 |
| 2020 | $5,290 | $214,500 | $78,900 | $135,600 |
| 2019 | $5,217 | $214,500 | $78,900 | $135,600 |
| 2018 | $5,079 | $214,500 | $78,900 | $135,600 |
| 2017 | $5,002 | $214,500 | $78,900 | $135,600 |
| 2016 | $4,964 | $214,500 | $78,900 | $135,600 |
| 2015 | $4,894 | $208,800 | $72,400 | $136,400 |
| 2014 | $4,907 | $208,800 | $72,400 | $136,400 |
| 2013 | $4,733 | $208,800 | $72,400 | $136,400 |
Source: Public Records
Map
Nearby Homes