Estimated Value: $311,453 - $379,000
2
Beds
2
Baths
872
Sq Ft
$395/Sq Ft
Est. Value
About This Home
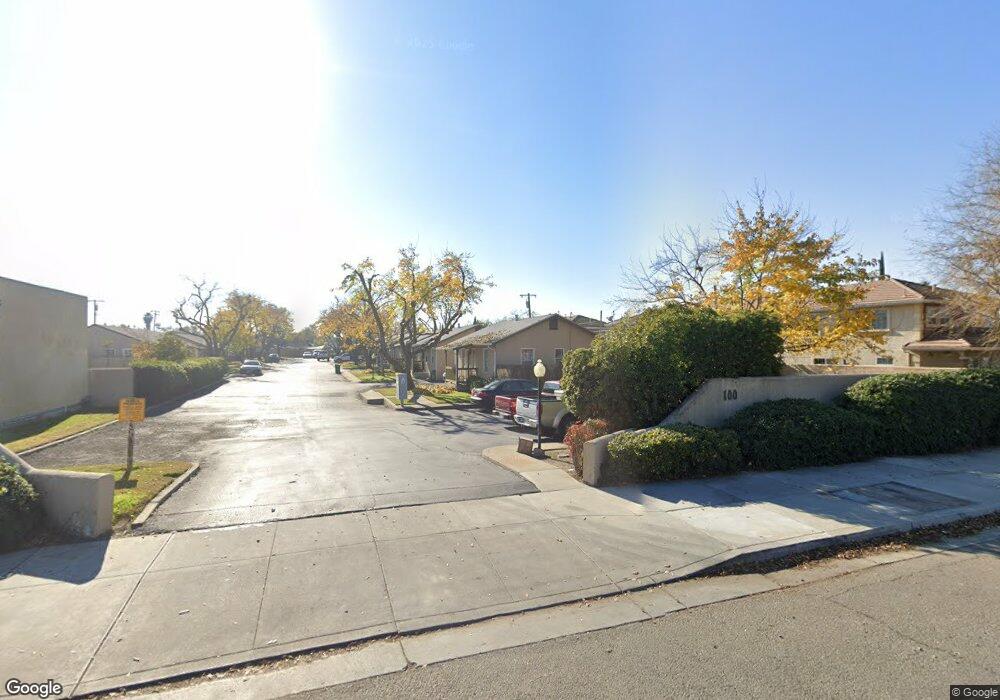
This home is located at 100 E Grant Line Rd Unit 2, Tracy, CA 95376 and is currently estimated at $344,113, approximately $394 per square foot. 100 E Grant Line Rd Unit 2 is a home located in San Joaquin County with nearby schools including Central Elementary School, Tracy High School, and Primary Charter School.
Ownership History
Date
Name
Owned For
Owner Type
Purchase Details
Closed on
Dec 11, 2001
Sold by
Peralta Joe Albert and Peralta Felice Mercedes
Bought by
Peralta Joe Albert and Peralta Felice Mercedes
Current Estimated Value
Home Financials for this Owner
Home Financials are based on the most recent Mortgage that was taken out on this home.
Original Mortgage
$47,000
Interest Rate
6.87%
Purchase Details
Closed on
Oct 19, 2001
Sold by
Peralta Joe Albert and Peralta Felice Mercedes
Bought by
Peralta Joe Albert and Peralta Felice Mercedes
Home Financials for this Owner
Home Financials are based on the most recent Mortgage that was taken out on this home.
Original Mortgage
$47,000
Interest Rate
6.87%
Purchase Details
Closed on
May 14, 2001
Sold by
Peralta Joe Albert and Peralta Felice Mercedes
Bought by
Peralta Joe Albert and Peralta Felice Mercedes
Purchase Details
Closed on
May 10, 1999
Sold by
Peralta Joe A
Bought by
Peralta Joe A and Peralta Felice M
Create a Home Valuation Report for This Property
The Home Valuation Report is an in-depth analysis detailing your home's value as well as a comparison with similar homes in the area
Home Values in the Area
Average Home Value in this Area
Purchase History
| Date | Buyer | Sale Price | Title Company |
|---|---|---|---|
| Peralta Joe Albert | -- | -- | |
| Peralta Joe Albert | -- | First American Title Guarant | |
| Peralta Joe Albert | -- | -- | |
| Peralta Joe A | -- | -- |
Source: Public Records
Mortgage History
| Date | Status | Borrower | Loan Amount |
|---|---|---|---|
| Closed | Peralta Joe Albert | $47,000 |
Source: Public Records
Tax History
| Year | Tax Paid | Tax Assessment Tax Assessment Total Assessment is a certain percentage of the fair market value that is determined by local assessors to be the total taxable value of land and additions on the property. | Land | Improvement |
|---|---|---|---|---|
| 2025 | $1,621 | $146,587 | $63,434 | $83,153 |
| 2024 | $1,491 | $143,714 | $62,191 | $81,523 |
| 2023 | $1,469 | $140,897 | $60,972 | $79,925 |
| 2022 | $1,437 | $138,135 | $59,777 | $78,358 |
| 2021 | $1,419 | $135,427 | $58,605 | $76,822 |
| 2020 | $1,409 | $134,040 | $58,005 | $76,035 |
| 2019 | $1,386 | $131,413 | $56,868 | $74,545 |
| 2018 | $1,361 | $128,837 | $55,753 | $73,084 |
| 2017 | $1,292 | $126,311 | $54,660 | $71,651 |
| 2016 | $1,306 | $123,836 | $53,589 | $70,247 |
| 2015 | $1,239 | $117,051 | $52,784 | $64,267 |
| 2014 | $1,136 | $112,000 | $27,200 | $84,800 |
Source: Public Records
Map
Nearby Homes
- 305 Portola Way
- 360 E Grant Line Rd Unit 11
- 360 E Grant Line Rd Unit SPC 18
- 360 E Grant Line Rd Unit 19 A
- 206 W 20th St
- 379 E 22nd St
- 2734 Balboa Dr
- 2935 Holly Dr
- 445 Royal Ct
- 264 W Emerson Ave
- 1930 Wall St
- 262 W Lowell Ave
- 1823 Wall St
- 1636 Parker Ave
- 1495 Mae Ave
- 251 Ramona Way
- 445 W Lowell Ave
- 143 W Beverly Place
- 2929 N Macarthur Dr Unit 173
- 252 W Clover Rd Unit A
- 100 E Grant Line Rd Unit 9
- 100 E Grant Line Rd Unit 8
- 100 E Grant Line Rd Unit 7
- 100 E Grant Line Rd Unit 6
- 100 E Grant Line Rd Unit 5
- 100 E Grant Line Rd Unit 4
- 100 E Grant Line Rd Unit 3
- 100 E Grant Line Rd
- 121 E 22nd St
- 115 E 22nd St
- 125 E 22nd St
- 111 E 22nd St
- 131 E 22nd St
- 109 E 22nd St
- 130 E Grant Line Rd Unit 1
- 130 E Grant Line Rd Unit 2
- 130 E Grant Line Rd Unit 3
- 130 E Grant Line Rd Unit 4
- 130 E Grant Line Rd Unit 5
- 130 E Grant Line Rd Unit 6
Your Personal Tour Guide
Ask me questions while you tour the home.