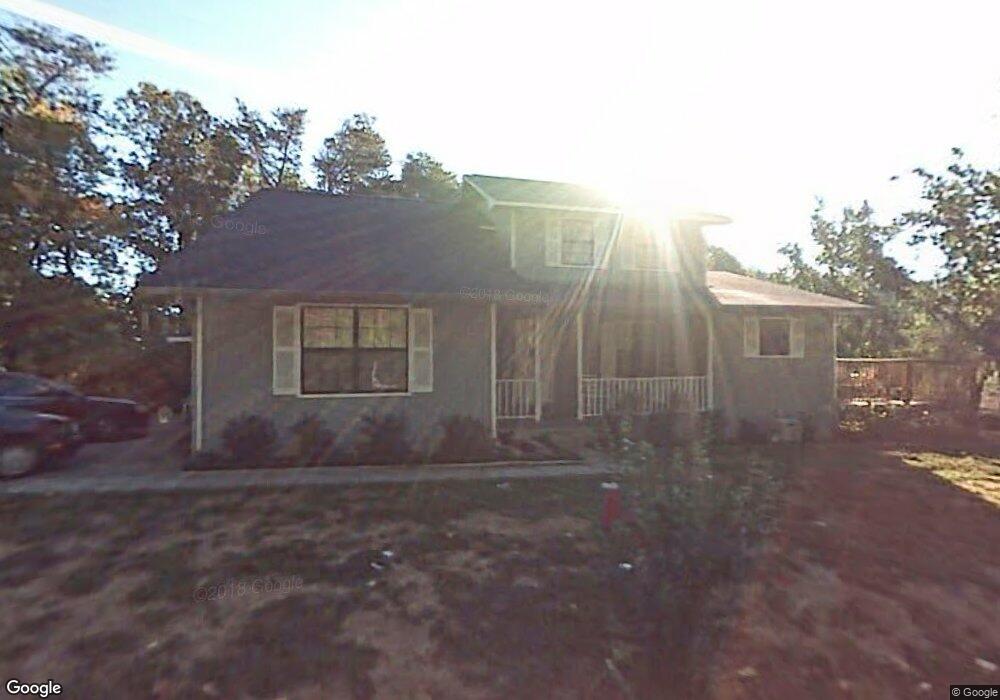
100 Fredonia Loop Dunlap, TN 37327
Estimated Value: $171,000 - $347,000
Studio
2
Baths
1,600
Sq Ft
$165/Sq Ft
Est. Value
About This Home
This home is located at 100 Fredonia Loop, Dunlap, TN 37327 and is currently estimated at $264,417, approximately $165 per square foot. 100 Fredonia Loop is a home located in Sequatchie County with nearby schools including Griffith Elementary School, Sequatchie County Middle School, and Sequatchie County High School.
Ownership History
Date
Name
Owned For
Owner Type
Purchase Details
Closed on
May 2, 2007
Sold by
Phylis Johnston
Bought by
Johnston Michael R
Current Estimated Value
Home Financials for this Owner
Home Financials are based on the most recent Mortgage that was taken out on this home.
Original Mortgage
$130,000
Outstanding Balance
$77,691
Interest Rate
6.12%
Estimated Equity
$186,726
Purchase Details
Closed on
May 22, 2006
Sold by
Bulyszyn Peter A
Bought by
Phylis Johnston
Home Financials for this Owner
Home Financials are based on the most recent Mortgage that was taken out on this home.
Original Mortgage
$119,700
Interest Rate
9.45%
Purchase Details
Closed on
Aug 28, 1992
Bought by
Bulyszyn Peter A and Wife Michelle
Purchase Details
Closed on
Apr 22, 1988
Bought by
Griffith Gregory and Wife Brenda
Create a Home Valuation Report for This Property
The Home Valuation Report is an in-depth analysis detailing your home's value as well as a comparison with similar homes in the area
Home Values in the Area
Average Home Value in this Area
Purchase History
| Date | Buyer | Sale Price | Title Company |
|---|---|---|---|
| Johnston Michael R | $130,000 | -- | |
| Phylis Johnston | $95,000 | -- | |
| Bulyszyn Peter A | $52,000 | -- | |
| Griffith Gregory | $3,500 | -- |
Source: Public Records
Mortgage History
| Date | Status | Borrower | Loan Amount |
|---|---|---|---|
| Open | Griffith Gregory | $130,000 | |
| Previous Owner | Griffith Gregory | $119,700 |
Source: Public Records
Tax History
| Year | Tax Paid | Tax Assessment Tax Assessment Total Assessment is a certain percentage of the fair market value that is determined by local assessors to be the total taxable value of land and additions on the property. | Land | Improvement |
|---|---|---|---|---|
| 2025 | $1,131 | $44,125 | $3,125 | $41,000 |
| 2024 | $1,131 | $46,800 | $3,125 | $43,675 |
| 2023 | $1,131 | $46,800 | $3,125 | $43,675 |
| 2022 | $913 | $27,500 | $3,025 | $24,475 |
| 2021 | $899 | $27,500 | $3,025 | $24,475 |
| 2020 | $899 | $27,500 | $3,025 | $24,475 |
| 2019 | $899 | $27,500 | $3,025 | $24,475 |
| 2018 | $889 | $27,500 | $3,025 | $24,475 |
| 2017 | $879 | $27,500 | $3,025 | $24,475 |
| 2016 | $849 | $25,500 | $3,025 | $22,475 |
| 2015 | $849 | $25,500 | $3,025 | $22,475 |
| 2014 | $849 | $25,500 | $3,025 | $22,475 |
Source: Public Records
Map
Nearby Homes
- 0 Fredonia Loop
- 11342 Fredonia Rd
- 21 Fredonia Rd
- 453 Hill Cir
- 2 Boulder Dr
- 217 A Day Dream Dr
- 267 Williams Rd
- 3 Fredonia Rd
- 1 Fredonia Rd
- 2000 Fredonia Rd
- 12 Fredonia Rd
- 2003 Fredonia Rd
- 2 Fredonia Rd
- 0 State Rt 399 Lot 13
- 481 Tram Trail
- 95 A Main St
- 341 Oak St
- 1 W Brow Rd
- 410 Cherry St
- Lot 36 River Ridge Dr
- 100 Fredonia Loop
- 100 Fredonia Rd
- 100 Fredonia Loop
- 100 Fredonia Loop
- 80 Fredonia Loop
- 115 Rebel Dr
- 162 Fredonia Loop
- 151 Rebel Dr
- 109 Rebel Dr
- 109 Rebel Dr
- 551 Fredonia Rd
- 421 Rebel Dr
- 52 Rebel Dr
- 0 0 Sr 399 Lot 2
- 100 Sr 399 Unit Lot 2
- 10 Sr 399 Unit Lot 2
- 100 Sr 399
- 10 Sr 399
- 496 Rebel Dr
- 109 Faith Ln
Your Personal Tour Guide
Ask me questions while you tour the home.