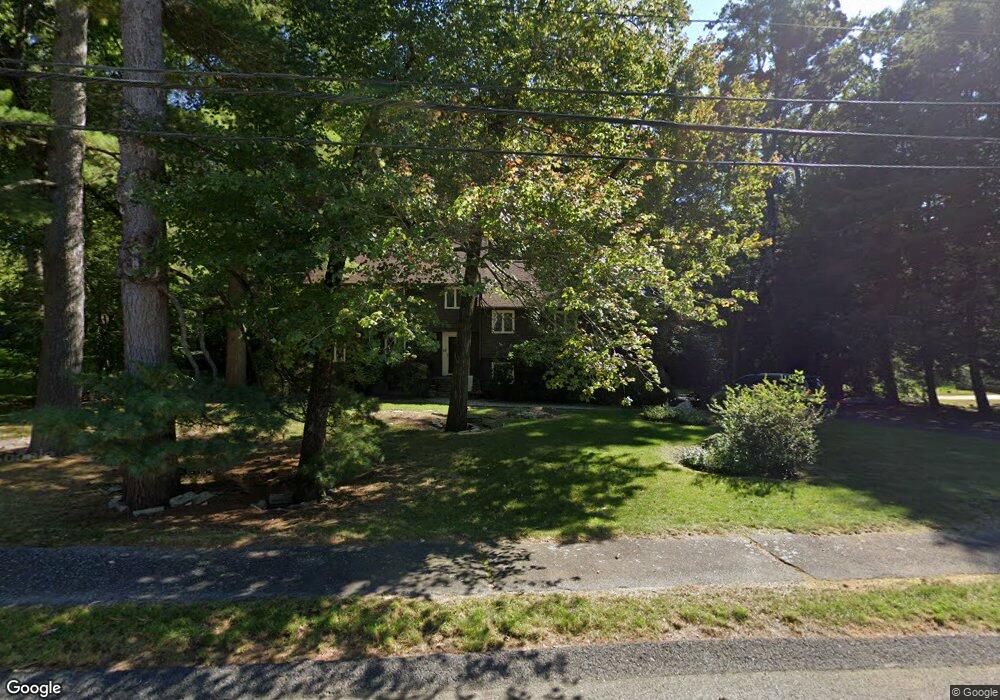
100 Richardson Dr Needham, MA 02492
Estimated Value: $1,467,000 - $1,836,718
About This Home
This home is located at 100 Richardson Dr, Needham, MA 02492 and is currently estimated at $1,686,930, approximately $1,425 per square foot. 100 Richardson Dr is a home located in Norfolk County with nearby schools including Newman Elementary School, High Rock Middle School, and Pollard Middle School.
Ownership History
We collect this data history from publicly available records. To have your information removed, we recommend requesting removal directly through your county’s website.
Purchase Details
Purchase Details
Purchase Details
Home Values in the Area
Average Home Value in this Area
Purchase History
We collect this data history from publicly available records. To have your information removed, we recommend requesting removal directly through your county’s website.
| Date | Buyer | Sale Price | Title Company |
|---|---|---|---|
| -- | -- | ||
| $480,000 | -- | ||
| $480,000 | -- |
Mortgage History
We collect this data history from publicly available records. To have your information removed, we recommend requesting removal directly through your county’s website.
| Date | Status | Borrower | Loan Amount |
|---|---|---|---|
| Previous Owner | $270,500 | ||
| Previous Owner | $22,000 |
Tax History
We collect this data history from publicly available records. To have your information removed, we recommend requesting removal directly through your county’s website.
| Year | Tax Paid | Tax Assessment Tax Assessment Total Assessment is a certain percentage of the fair market value that is determined by local assessors to be the total taxable value of land and additions on the property. | Land | Improvement |
|---|---|---|---|---|
| 2025 | $14,746 | $1,391,100 | $898,300 | $492,800 |
| 2024 | $14,581 | $1,164,600 | $701,600 | $463,000 |
| 2023 | $14,654 | $1,123,800 | $701,600 | $422,200 |
| 2022 | $14,782 | $1,105,600 | $701,600 | $404,000 |
| 2021 | $14,406 | $1,105,600 | $701,600 | $404,000 |
| 2020 | $14,366 | $1,150,200 | $701,600 | $448,600 |
| 2019 | $14,123 | $1,139,900 | $701,600 | $438,300 |
| 2018 | $13,542 | $1,139,900 | $701,600 | $438,300 |
| 2017 | $12,942 | $1,088,500 | $701,600 | $386,900 |
| 2016 | $12,610 | $1,092,700 | $701,600 | $391,100 |
| 2015 | $12,337 | $1,092,700 | $701,600 | $391,100 |
| 2014 | $12,515 | $1,075,200 | $701,600 | $373,600 |
Map
- 957 South St
- 287 High Rock St
- 20 Burr Dr
- 456 Chestnut St
- 64 Gayland Rd
- 430 High Rock St
- 366 Warren St
- 105 Blake St
- 46 Howland St Unit 46
- 8 Crestview Rd
- 72 Marked Tree Rd
- 4 Wilson's Way
- 1 Windsor Rd
- 19 Marked Tree Rd
- 1275 Central Ave
- 620 High Rock St
- 98 Bridle Trail Rd
- 70 Wilsondale St
- 46 Charles River St
- 1360 Great Plain Ave
- 86 Richardson Dr
- 110 Richardson Dr
- 99 Richardson Dr
- 111 Richardson Dr
- 74 Richardson Dr
- 14 Stonehurst Rd
- 77 Richardson Dr
- 122 Richardson Dr
- 122 Richardson Dr Unit 122
- 121 Richardson Dr
- 75 Farley Pond Ln
- 22 Stonehurst Rd
- 11 Aldridge Rd
- 133 Richardson Dr
- 65 Richardson Dr
- 34 Stonehurst Rd
- 138 Richardson Dr
- 51 Aldridge Rd
- 55 Farley Pond Ln
- 29 Aldridge Rd
Ask me questions while you tour the home.