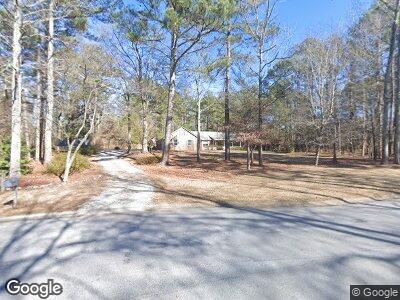
100 Rockington Dr Tyrone, GA 30290
Estimated Value: $413,485 - $479,000
--
Bed
3
Baths
2,124
Sq Ft
$210/Sq Ft
Est. Value
About This Home
This home is located at 100 Rockington Dr, Tyrone, GA 30290 and is currently estimated at $446,371, approximately $210 per square foot. 100 Rockington Dr is a home located in Fayette County with nearby schools including Crabapple Lane Elementary School, Flat Rock Middle School, and Sandy Creek High School.
Create a Home Valuation Report for This Property
The Home Valuation Report is an in-depth analysis detailing your home's value as well as a comparison with similar homes in the area
Home Values in the Area
Average Home Value in this Area
Tax History Compared to Growth
Tax History
| Year | Tax Paid | Tax Assessment Tax Assessment Total Assessment is a certain percentage of the fair market value that is determined by local assessors to be the total taxable value of land and additions on the property. | Land | Improvement |
|---|---|---|---|---|
| 2024 | $1,669 | $163,596 | $36,000 | $127,596 |
| 2023 | $1,521 | $157,400 | $36,000 | $121,400 |
| 2022 | $1,578 | $151,080 | $36,000 | $115,080 |
| 2021 | $1,166 | $113,040 | $16,200 | $96,840 |
| 2020 | $1,113 | $105,760 | $16,200 | $89,560 |
| 2019 | $1,069 | $100,680 | $16,200 | $84,480 |
| 2018 | $1,009 | $95,240 | $16,200 | $79,040 |
| 2017 | $943 | $88,400 | $16,200 | $72,200 |
| 2016 | $875 | $79,600 | $16,200 | $63,400 |
| 2015 | $828 | $73,960 | $16,200 | $57,760 |
| 2014 | $735 | $63,960 | $16,200 | $47,760 |
| 2013 | -- | $62,000 | $0 | $0 |
Source: Public Records
Map
Nearby Homes
- 210 Crestwood Rd
- 198 Crestwood Rd
- 101 Kenmare Row
- 265 Castlewood Rd
- 205 Castlewood Rd
- 100 Clydesdale Ct
- 106 Tullamore Trail
- 164 Castlewood Rd
- 115 W Wind Ct
- 130 Windchime Way Unit 9
- 119 Castlewood Rd
- 220 Drumcliff Ct
- 110 Kylemore Pass
- 255 Ashmere Ct
- 90 Bellview Ridge
- 115 Foxford Run
- 119 Brookgrove Ln
- 175 Carriage Gate Dr
- 165 Carriage Gate Dr
- 416 Line Creek Cir
- 100 Rockington Dr
- 110 Rockington Dr
- 120 Rockington Dr
- 105 Rockington Dr
- 126 Magnolia Dr
- 105 Rockport Trace
- 124 Magnolia Dr
- 124 Magnolia Dr
- W W Crestwood Rd
- 100 Rockport Trace
- 130 Rockington Dr
- 135 Rockington Dr
- 0 Rockington Dr Unit 7049929
- 0 Rockington Dr Unit 8869215
- 0 Rockington Dr Unit 8327673
- 0 Rockington Dr Unit 8163494
- 0 Rockington Dr Unit 3216392
- 0 Rockington Dr Unit 3088035
- 0 Rockington Dr
- 115 Rockport Trace