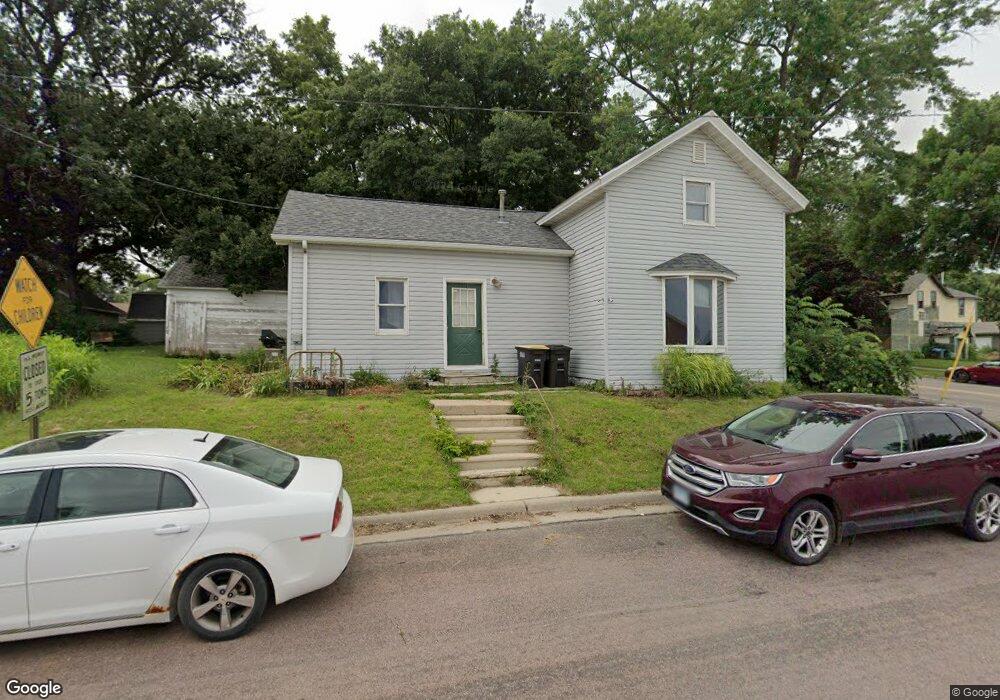
100 S Halladay St Good Thunder, MN 56037
Estimated Value: $136,360 - $239,000
About This Home
This home is located at 100 S Halladay St, Good Thunder, MN 56037 and is currently estimated at $187,090, approximately $155 per square foot. 100 S Halladay St is a home located in Blue Earth County with nearby schools including Maple River Secondary School and St. John Lutheran School.
Ownership History
We collect this data history from publicly available records. To have your information removed, we recommend requesting removal directly through your county’s website.
Purchase Details
Home Financials for this Owner
Home Financials are based on the most recent Mortgage that was taken out on this home.Purchase History
We collect this data history from publicly available records. To have your information removed, we recommend requesting removal directly through your county’s website.
| Date | Buyer | Sale Price | Title Company |
|---|---|---|---|
| $79,000 | -- |
Mortgage History
We collect this data history from publicly available records. To have your information removed, we recommend requesting removal directly through your county’s website.
| Date | Status | Borrower | Loan Amount |
|---|---|---|---|
| Open | $80,000 |
Tax History
We collect this data history from publicly available records. To have your information removed, we recommend requesting removal directly through your county’s website.
| Year | Tax Paid | Tax Assessment Tax Assessment Total Assessment is a certain percentage of the fair market value that is determined by local assessors to be the total taxable value of land and additions on the property. | Land | Improvement |
|---|---|---|---|---|
| 2026 | $1,408 | $112,400 | $22,600 | $89,800 |
| 2025 | $1,408 | $114,600 | $22,600 | $92,000 |
| 2024 | $1,346 | $107,800 | $22,600 | $85,200 |
| 2023 | $1,498 | $111,100 | $22,600 | $88,500 |
| 2022 | $1,254 | $104,500 | $22,600 | $81,900 |
| 2021 | $1,266 | $81,600 | $22,600 | $59,000 |
| 2020 | $1,008 | $77,800 | $22,600 | $55,200 |
| 2019 | $956 | $77,800 | $22,600 | $55,200 |
| 2018 | $922 | $68,500 | $17,000 | $51,500 |
| 2017 | $914 | $68,500 | $17,000 | $51,500 |
| 2016 | $898 | $68,500 | $17,000 | $51,500 |
| 2015 | $9 | $65,000 | $17,000 | $48,000 |
| 2014 | $1,060 | $66,900 | $17,000 | $49,900 |
Map
- 16280 552nd Ave
- 16244 560th Ln
- 17069 State Highway 66
- 555th Ave
- 14400 532nd Ln
- 55997 132nd St
- 57400 178th Ln
- 56979 178th Ln
- 101 Mapleridge Dr
- 178th Lane
- 568th Ave
- 568th Avenue
- 277 Red Ridge Rd
- 53508 192nd Ln
- 108 1st Ave NW
- 309 2nd Ave NE
- 409 4th Ave NE
- 207 Lincoln St SW
- 310 4th Ave SE
- 409 4th Ave SE
Ask me questions while you tour the home.