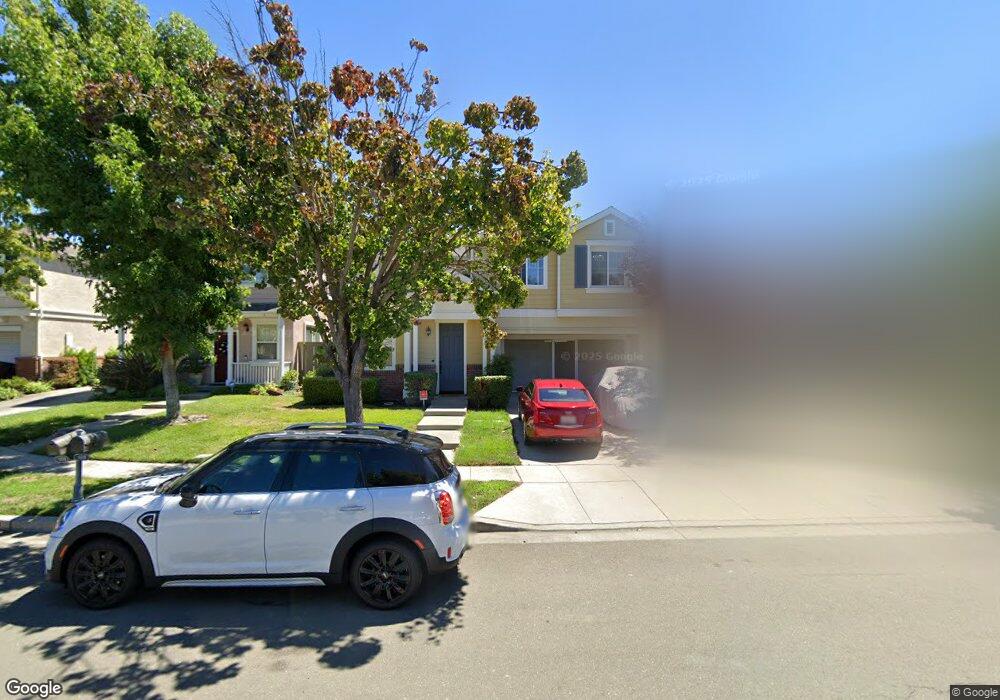
100 Sweet Gum Ct Hercules, CA 94547
New Pacific NeighborhoodEstimated Value: $855,000 - $977,000
4
Beds
3
Baths
2,108
Sq Ft
$430/Sq Ft
Est. Value
About This Home
This home is located at 100 Sweet Gum Ct, Hercules, CA 94547 and is currently estimated at $907,013, approximately $430 per square foot. 100 Sweet Gum Ct is a home located in Contra Costa County with nearby schools including Lupine Hills Elementary School, Hercules Middle School, and Hercules High School.
Ownership History
Date
Name
Owned For
Owner Type
Purchase Details
Closed on
Feb 28, 2025
Sold by
Moreland Kamili and Moreland Anthony
Bought by
Moreland Family Trust and Moreland
Current Estimated Value
Purchase Details
Closed on
Jun 27, 2018
Sold by
Moreland Kamili
Bought by
Moreland Kamili and Moreland Anthony
Purchase Details
Closed on
Mar 26, 2008
Sold by
Dawson Charohn L
Bought by
Dawson Kamili Williams
Purchase Details
Closed on
Oct 9, 2003
Sold by
Williams Kamili A
Bought by
Dawson Charohn L and Dawson Kamili Williams
Purchase Details
Closed on
May 5, 2003
Sold by
First American Title Guaranty Co
Bought by
Williams Kamili A
Home Financials for this Owner
Home Financials are based on the most recent Mortgage that was taken out on this home.
Original Mortgage
$400,000
Interest Rate
5.12%
Mortgage Type
Purchase Money Mortgage
Create a Home Valuation Report for This Property
The Home Valuation Report is an in-depth analysis detailing your home's value as well as a comparison with similar homes in the area
Home Values in the Area
Average Home Value in this Area
Purchase History
| Date | Buyer | Sale Price | Title Company |
|---|---|---|---|
| Moreland Family Trust | -- | None Listed On Document | |
| Moreland Kamili | -- | Accommodation | |
| Moreland Kamili | -- | Lawyers Title | |
| Moreland Kamili | -- | Lawyers Title Oc | |
| Dawson Kamili Williams | -- | None Available | |
| Dawson Charohn L | -- | -- | |
| Williams Kamili A | $501,000 | First American Title |
Source: Public Records
Mortgage History
| Date | Status | Borrower | Loan Amount |
|---|---|---|---|
| Previous Owner | Williams Kamili A | $400,000 | |
| Closed | Williams Kamili A | $50,675 |
Source: Public Records
Tax History Compared to Growth
Tax History
| Year | Tax Paid | Tax Assessment Tax Assessment Total Assessment is a certain percentage of the fair market value that is determined by local assessors to be the total taxable value of land and additions on the property. | Land | Improvement |
|---|---|---|---|---|
| 2025 | $11,183 | $725,159 | $341,363 | $383,796 |
| 2024 | $11,183 | $710,941 | $334,670 | $376,271 |
| 2023 | $10,987 | $697,002 | $328,108 | $368,894 |
| 2022 | $10,837 | $683,336 | $321,675 | $361,661 |
| 2021 | $10,820 | $669,938 | $315,368 | $354,570 |
| 2019 | $10,248 | $650,069 | $306,015 | $344,054 |
| 2018 | $9,936 | $637,323 | $300,015 | $337,308 |
| 2017 | $10,672 | $607,000 | $285,741 | $321,259 |
| 2016 | $10,036 | $565,000 | $265,969 | $299,031 |
| 2015 | $9,267 | $503,000 | $236,783 | $266,217 |
| 2014 | $8,604 | $439,000 | $206,656 | $232,344 |
Source: Public Records
Map
Nearby Homes
- 1003 Craftsman Dr
- 106 Sweet Gum Ct
- 1009 Craftsman Dr
- 112 Sweet Gum Ct
- 133 Jacaranda Ct
- 127 Jacaranda Ct
- 139 Jacaranda Ct
- 1015 Craftsman Dr
- 121 Jacaranda Ct
- 115 Jacaranda Ct
- 1021 Craftsman Dr
- 103 Sweet Gum Ct
- 109 Sweet Gum Ct
- 109 Jacaranda Ct
- 1000 Craftsman Dr
- 115 Sweet Gum Ct
- 1006 Craftsman Dr
- 121 Sweet Gum Ct
- 103 Jacaranda Ct
- 124 Jacaranda Ct