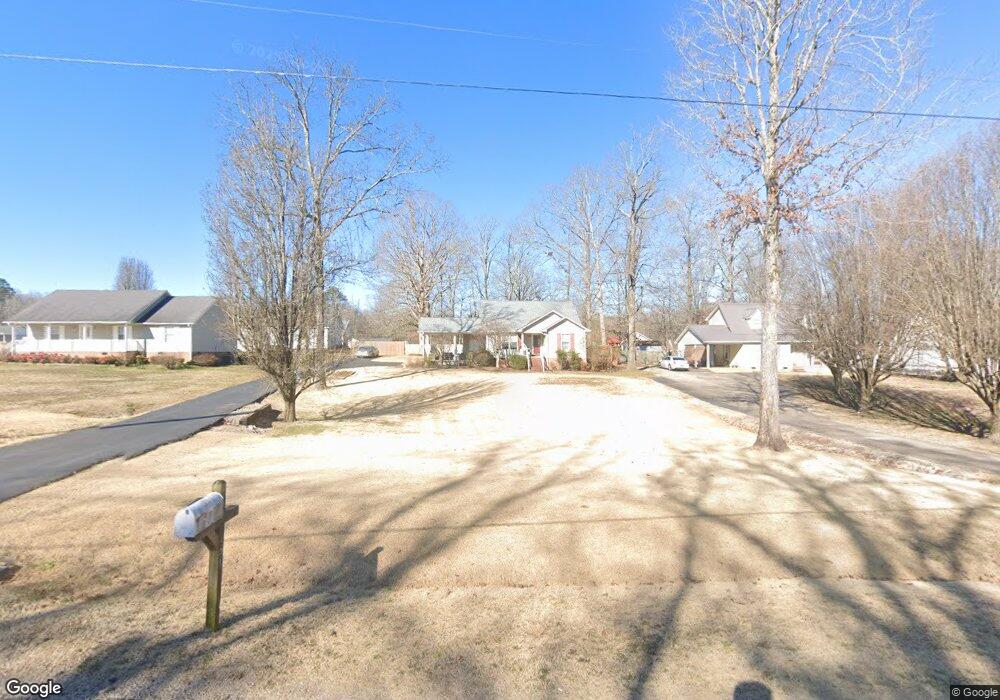
100 Tom Way Savannah, TN 38372
Estimated Value: $184,507 - $229,000
Studio
2
Baths
1,236
Sq Ft
$163/Sq Ft
Est. Value
About This Home
This home is located at 100 Tom Way, Savannah, TN 38372 and is currently estimated at $201,627, approximately $163 per square foot. 100 Tom Way is a home located in Hardin County with nearby schools including Hardin County High School.
Ownership History
Date
Name
Owned For
Owner Type
Purchase Details
Closed on
Jun 4, 2021
Sold by
Bullington Dolores Faye and Branscum Scott
Bought by
Branscum Scott Euguene and Branscum Christine Ann
Current Estimated Value
Purchase Details
Closed on
Jan 24, 2017
Sold by
Bullington Dolores F
Bought by
Bullington Dolores Faye
Purchase Details
Closed on
Aug 31, 2016
Sold by
Bullington Dolores F
Bought by
Bullington Dolores F
Purchase Details
Closed on
Feb 4, 2005
Sold by
Rainey Lee
Bought by
Bullington Dolores F
Purchase Details
Closed on
Mar 22, 2004
Sold by
Cossey Donnie L
Bought by
Rainey Lee
Purchase Details
Closed on
Nov 14, 2001
Sold by
Alexander Bruce
Bought by
Cossey Donnie L
Home Financials for this Owner
Home Financials are based on the most recent Mortgage that was taken out on this home.
Original Mortgage
$85,655
Interest Rate
6.54%
Purchase Details
Closed on
May 9, 1990
Bought by
Haggard Tom
Purchase Details
Closed on
May 7, 1954
Bought by
Austin Granville Heirs
Create a Home Valuation Report for This Property
The Home Valuation Report is an in-depth analysis detailing your home's value as well as a comparison with similar homes in the area
Home Values in the Area
Average Home Value in this Area
Purchase History
| Date | Buyer | Sale Price | Title Company |
|---|---|---|---|
| Branscum Scott Euguene | -- | None Available | |
| Bullington Dolores Faye | -- | -- | |
| Bullington Dolores F | -- | -- | |
| Branscum Scott | -- | -- | |
| Bullington Dolores F | $93,000 | -- | |
| Rainey Lee | $87,500 | -- | |
| Cossey Donnie L | $87,000 | -- | |
| Haggard Tom | -- | -- | |
| Austin Granville Heirs | -- | -- |
Source: Public Records
Mortgage History
| Date | Status | Borrower | Loan Amount |
|---|---|---|---|
| Previous Owner | Austin Granville Heirs | $85,655 |
Source: Public Records
Tax History
| Year | Tax Paid | Tax Assessment Tax Assessment Total Assessment is a certain percentage of the fair market value that is determined by local assessors to be the total taxable value of land and additions on the property. | Land | Improvement |
|---|---|---|---|---|
| 2025 | $628 | $35,875 | $4,625 | $31,250 |
| 2024 | $628 | $35,875 | $4,625 | $31,250 |
| 2023 | $628 | $35,875 | $4,625 | $31,250 |
| 2022 | $439 | $21,300 | $2,150 | $19,150 |
| 2021 | $439 | $21,300 | $2,150 | $19,150 |
| 2020 | $439 | $21,300 | $2,150 | $19,150 |
| 2019 | $439 | $21,300 | $2,150 | $19,150 |
| 2018 | $424 | $21,300 | $2,150 | $19,150 |
| 2017 | $440 | $21,150 | $2,150 | $19,000 |
| 2016 | $440 | $21,150 | $2,150 | $19,000 |
| 2015 | $385 | $21,150 | $2,150 | $19,000 |
| 2014 | $385 | $21,150 | $2,150 | $19,000 |
Source: Public Records
Map
Nearby Homes
- 145 Tom Way
- 140 Ancil Way
- 6170 Tennessee 226
- 370 Serenity Dr
- 30 Rodeo Way
- 0 Cedar Cove Ln
- 460 Andrews Ln
- 115 Partridge Ln
- 1075 Tennessee 203
- 1075 Highway 203
- 435 Cedar Cove Ln
- 1820 Pinhook Rd
- 5115 Tennessee 226
- 470 Olivet Dr
- 95 Squaw St
- 134 Horse Creek Rd
- 0 Cordova Cove
- 645 Wildflower Ridge Ln
- LOT 34 Cordova Cove
- 190 Cordova Cove
Your Personal Tour Guide
Ask me questions while you tour the home.