
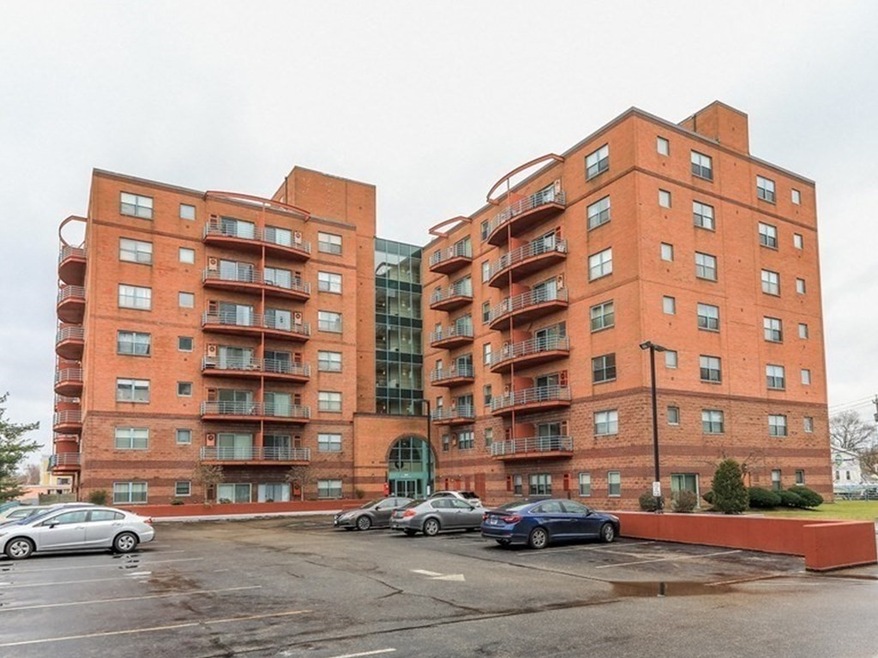
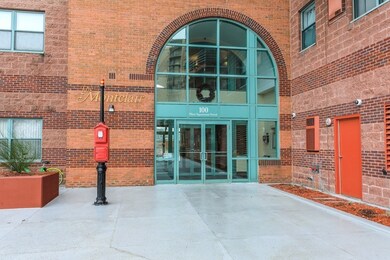
The Montclair Condominiums 100 W Squantum St Unit 109 Quincy, MA 02171
Montclair Neighborhood
1
Bed
1
Bath
590
Sq Ft
$420/mo
HOA Fee
Highlights
- Resident Manager or Management On Site
- 4-minute walk to North Quincy Station
- 5-minute walk to Bishop Playground
- North Quincy High School Rated A
About This Home
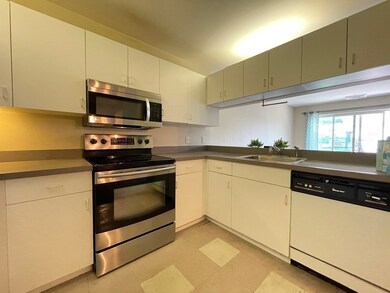
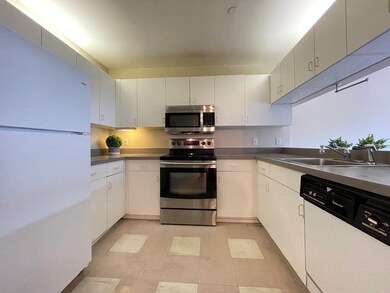
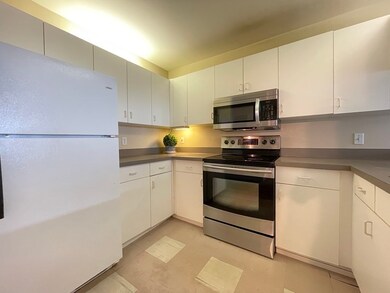
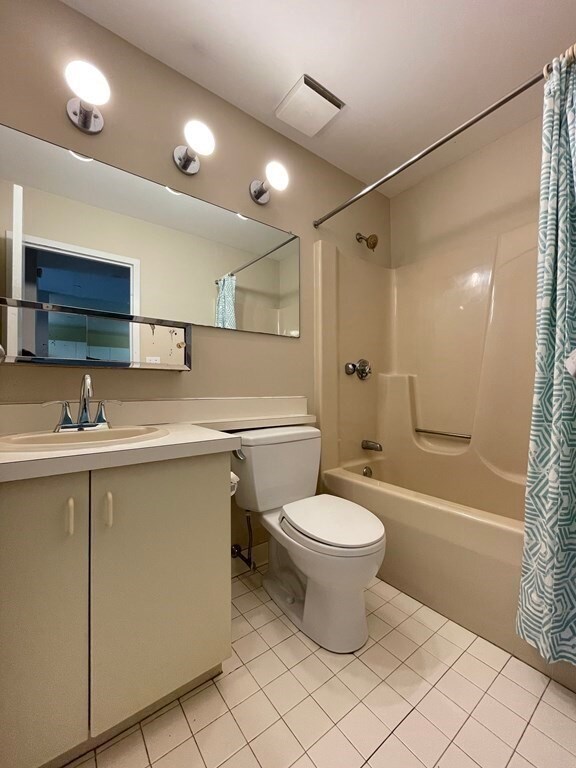
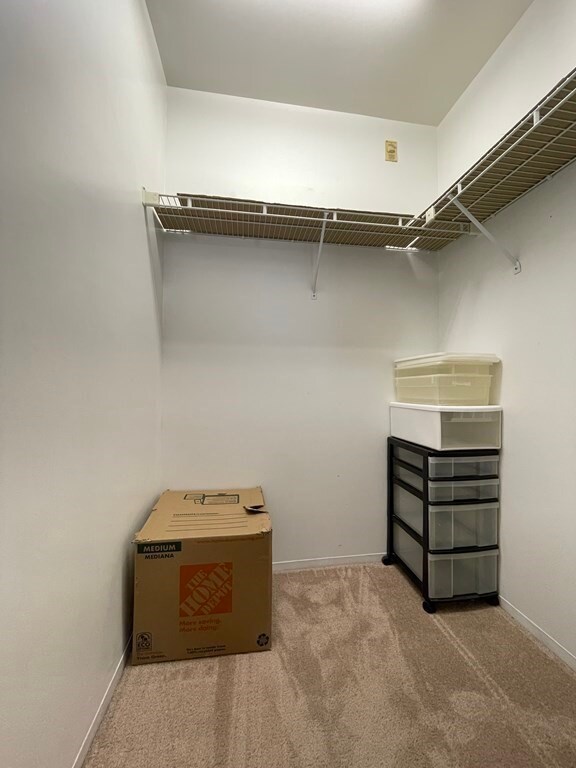
As of January 2025One of the most popular locations in North Quincy. 5 Mins walk to North Quincy T station. short distance to Boston, ideal for commuters. This is a 1st floor unit with carpeted in good condition with large closets. In-building laundry and meeting room on the same floor. 2 Deeded garage parking spaces 69 & 117. Direct access to large outside green space and covered by the balcony above. Current construction is ongoing, imagine when the project is completed! This will be a perfect home for you. The seller has been paid off the assessment fee already.
Property Details
Home Type
- Condominium
Est. Annual Taxes
- $3,539
Year Built
- 1988
HOA Fees
- $420 per month
Parking
- 2
Utilities
- 1 Heating Zone
Community Details
- Common Area
- Resident Manager or Management On Site
Ownership History
Date
Name
Owned For
Owner Type
Purchase Details
Listed on
Nov 9, 2024
Closed on
Jan 7, 2025
Sold by
Szymanski Krzysztof and Gielazyn Anna
Bought by
Chen Yimin
Seller's Agent
Ann Stewart
Coldwell Banker Realty - Cohasset
Buyer's Agent
Winston Sheng Li
Blue Ocean Realty, LLC
List Price
$379,000
Sold Price
$350,000
Premium/Discount to List
-$29,000
-7.65%
Views
37
Current Estimated Value
Home Financials for this Owner
Home Financials are based on the most recent Mortgage that was taken out on this home.
Estimated Appreciation
-$3,002
Avg. Annual Appreciation
-0.25%
Original Mortgage
$190,000
Outstanding Balance
$189,519
Interest Rate
6.88%
Mortgage Type
Purchase Money Mortgage
Estimated Equity
$159,995
Purchase Details
Listed on
Sep 15, 2021
Closed on
Oct 19, 2021
Sold by
Lin Zihua
Bought by
Szymanski Krzysztof and Gielazyn Anna
Seller's Agent
Justin Mai
Denkar Realty Group
Buyer's Agent
Ann Stewart
Coldwell Banker Realty - Cohasset
List Price
$304,900
Sold Price
$300,000
Premium/Discount to List
-$4,900
-1.61%
Home Financials for this Owner
Home Financials are based on the most recent Mortgage that was taken out on this home.
Avg. Annual Appreciation
4.95%
Purchase Details
Listed on
Jul 8, 2015
Closed on
Jul 8, 2015
Sold by
Sweeney Joseph W
Bought by
Lin Zihua
Seller's Agent
Jian Zhi Tan
Central Real Estate
Buyer's Agent
Claudia Correa
United Brokers
Sold Price
$1,500
Home Financials for this Owner
Home Financials are based on the most recent Mortgage that was taken out on this home.
Avg. Annual Appreciation
4.81%
Purchase Details
Closed on
Nov 28, 2000
Sold by
Tzortzis Jackey
Bought by
Sweeney Jsoeph W
Purchase Details
Closed on
May 6, 1999
Sold by
Rand Robert P and Rand Holly A
Bought by
Tzortzis Jackey
Home Financials for this Owner
Home Financials are based on the most recent Mortgage that was taken out on this home.
Original Mortgage
$71,250
Interest Rate
6.92%
Mortgage Type
Purchase Money Mortgage
Similar Homes in Quincy, MA
Create a Home Valuation Report for This Property
The Home Valuation Report is an in-depth analysis detailing your home's value as well as a comparison with similar homes in the area
Home Values in the Area
Average Home Value in this Area
Purchase History
| Date | Type | Sale Price | Title Company |
|---|---|---|---|
| Condominium Deed | $350,000 | None Available | |
| Condominium Deed | $350,000 | None Available | |
| Not Resolvable | $300,000 | None Available | |
| Not Resolvable | $223,000 | -- | |
| Deed | $125,000 | -- | |
| Deed | $75,000 | -- |
Source: Public Records
Mortgage History
| Date | Status | Loan Amount | Loan Type |
|---|---|---|---|
| Open | $190,000 | Purchase Money Mortgage | |
| Closed | $190,000 | Purchase Money Mortgage | |
| Previous Owner | $71,250 | Purchase Money Mortgage |
Source: Public Records
Property History
| Date | Event | Price | Change | Sq Ft Price |
|---|---|---|---|---|
| 01/07/2025 01/07/25 | Sold | $350,000 | -7.7% | $593 / Sq Ft |
| 11/22/2024 11/22/24 | Pending | -- | -- | -- |
| 11/09/2024 11/09/24 | For Sale | $379,000 | 0.0% | $642 / Sq Ft |
| 11/07/2024 11/07/24 | Off Market | $1,900 | -- | -- |
| 10/17/2024 10/17/24 | For Rent | $1,900 | 0.0% | -- |
| 10/29/2021 10/29/21 | Sold | $300,000 | -1.6% | $508 / Sq Ft |
| 10/06/2021 10/06/21 | Pending | -- | -- | -- |
| 09/15/2021 09/15/21 | For Sale | $304,900 | 0.0% | $517 / Sq Ft |
| 06/08/2017 06/08/17 | Rented | $1,500 | 0.0% | -- |
| 06/07/2017 06/07/17 | Under Contract | -- | -- | -- |
| 06/05/2017 06/05/17 | For Rent | $1,500 | -6.3% | -- |
| 09/02/2016 09/02/16 | Rented | $1,600 | 0.0% | -- |
| 09/01/2016 09/01/16 | Under Contract | -- | -- | -- |
| 08/29/2016 08/29/16 | For Rent | $1,600 | 0.0% | -- |
| 07/08/2015 07/08/15 | Sold | $223,000 | 0.0% | $378 / Sq Ft |
| 07/08/2015 07/08/15 | Rented | $1,500 | 0.0% | -- |
| 07/08/2015 07/08/15 | For Rent | $1,500 | 0.0% | -- |
| 06/24/2015 06/24/15 | Pending | -- | -- | -- |
| 05/21/2015 05/21/15 | Off Market | $223,000 | -- | -- |
| 05/14/2015 05/14/15 | For Sale | $229,000 | -- | $388 / Sq Ft |
Source: MLS Property Information Network (MLS PIN)
Tax History Compared to Growth
Tax History
| Year | Tax Paid | Tax Assessment Tax Assessment Total Assessment is a certain percentage of the fair market value that is determined by local assessors to be the total taxable value of land and additions on the property. | Land | Improvement |
|---|---|---|---|---|
| 2025 | $3,539 | $306,900 | $0 | $306,900 |
| 2024 | $3,550 | $315,000 | $0 | $315,000 |
| 2023 | $3,099 | $278,400 | $0 | $278,400 |
| 2022 | $3,212 | $268,100 | $0 | $268,100 |
| 2021 | $3,059 | $252,000 | $0 | $252,000 |
| 2020 | $3,319 | $267,000 | $0 | $267,000 |
| 2019 | $3,543 | $282,300 | $0 | $282,300 |
| 2018 | $3,022 | $226,500 | $0 | $226,500 |
| 2017 | $2,945 | $207,800 | $0 | $207,800 |
| 2016 | $2,800 | $195,000 | $0 | $195,000 |
| 2015 | $2,698 | $184,800 | $0 | $184,800 |
| 2014 | -- | $174,800 | $0 | $174,800 |
Source: Public Records
Agents Affiliated with this Home
-
A
Seller's Agent in 2025
Ann Stewart
Coldwell Banker Realty - Cohasset
2 in this area
13 Total Sales
-
Buyer's Agent in 2025
Winston Sheng Li
Blue Ocean Realty, LLC
(617) 615-9213
2 in this area
21 Total Sales
-
Seller's Agent in 2021
Justin Mai
Denkar Realty Group
(617) 331-1186
2 in this area
19 Total Sales
-
J
Seller's Agent in 2017
Jian Zhi Tan
Central Real Estate
(617) 480-3696
5 in this area
40 Total Sales
-
J
Buyer's Agent in 2016
Jason Yung
East Coast Realty, Inc.
-
Seller's Agent in 2015
Norman Tuttle
GRANITE GROUP REALTORS®
(617) 429-7749
1 in this area
27 Total Sales
About The Montclair Condominiums
Map
Source: MLS Property Information Network (MLS PIN)
MLS Number: 72895313
APN: QUIN-006107-000001-000109
Disclaimer: Certain information contained herein is derived from information provided by parties other than Homes.com. All information provided is deemed reliable, but is not guaranteed to be accurate and should be independently verified.
![]() The property listing data and information, or the Images, set forth herein were provided to MLS Property Information Network, Inc. from third party sources, including sellers, lessors and public records, and were compiled by MLS Property Information Network, Inc. The property listing data and information, and the Images, are for the personal, non-commercial use of consumers having a good faith interest in purchasing or leasing listed properties of the type displayed to them and may not be used for any purpose other than to identify prospective properties which such consumers may have a good faith interest in purchasing or leasing. MLS Property Information Network, Inc. and its subscribers disclaim any and all representations and warranties as to the accuracy of the property listing data and information, or as to the accuracy of any of the Images, set forth herein.
The property listing data and information, or the Images, set forth herein were provided to MLS Property Information Network, Inc. from third party sources, including sellers, lessors and public records, and were compiled by MLS Property Information Network, Inc. The property listing data and information, and the Images, are for the personal, non-commercial use of consumers having a good faith interest in purchasing or leasing listed properties of the type displayed to them and may not be used for any purpose other than to identify prospective properties which such consumers may have a good faith interest in purchasing or leasing. MLS Property Information Network, Inc. and its subscribers disclaim any and all representations and warranties as to the accuracy of the property listing data and information, or as to the accuracy of any of the Images, set forth herein.
Nearby Homes
- 39 Fayette St Unit 102
- 7 Holmes St
- 98 Safford St
- 120 Holmes St Unit 309
- 120 Holmes St Unit 205
- 14 Ruthven St
- 164 Farrington St
- 85 E Squantum St Unit 10
- 122 E Squantum St Unit 2
- 143 Arlington St
- 204 Farrington St
- 21 Linden St Unit 318
- 21 Linden St Unit 133
- 21 Linden St Unit 210
- 522 Hancock St
- 94 Newbury Ave Unit 403
- 39 Newbury Ave
- 174 N Central Ave
- 270 Wilson Ave
- 60 Newbury St Unit 10