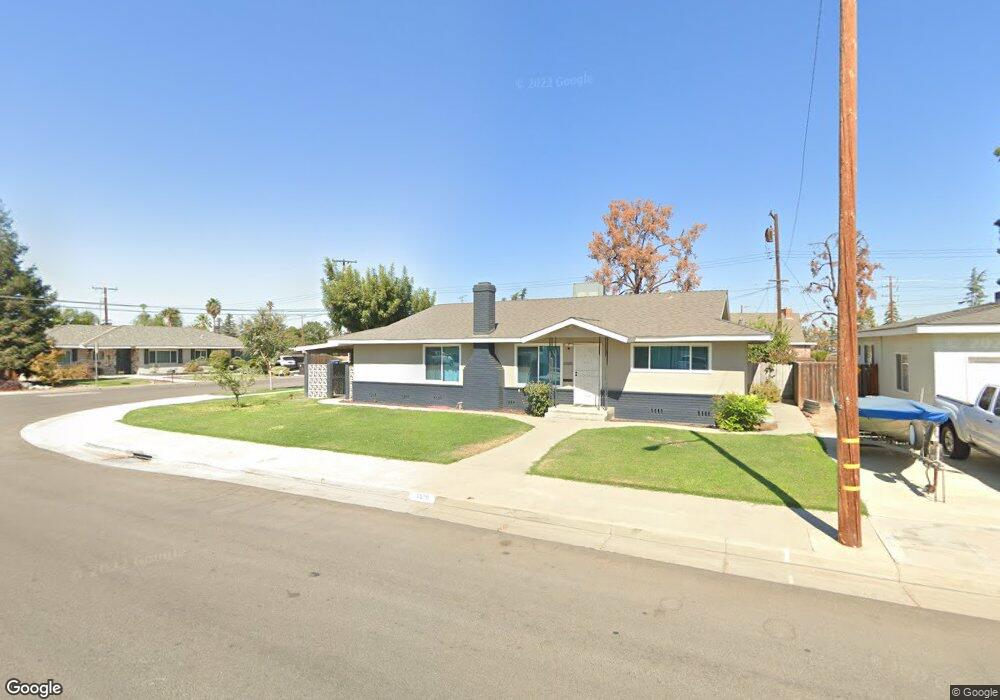
1000 E Lyndale Ave Tulare, CA 93274
Northeast Tulare NeighborhoodEstimated Value: $327,277 - $355,000
3
Beds
2
Baths
1,632
Sq Ft
$207/Sq Ft
Est. Value
About This Home
This home is located at 1000 E Lyndale Ave, Tulare, CA 93274 and is currently estimated at $337,069, approximately $206 per square foot. 1000 E Lyndale Ave is a home located in Tulare County with nearby schools including Garden Elementary School, Cherry Avenue Middle School, and Tulare Western High School.
Ownership History
Date
Name
Owned For
Owner Type
Purchase Details
Closed on
Oct 17, 2004
Sold by
Renteria Alfredo
Bought by
Renteria Fernandina
Current Estimated Value
Home Financials for this Owner
Home Financials are based on the most recent Mortgage that was taken out on this home.
Original Mortgage
$140,800
Outstanding Balance
$69,591
Interest Rate
5.74%
Mortgage Type
New Conventional
Estimated Equity
$267,478
Purchase Details
Closed on
Feb 21, 2003
Sold by
Mussellman Russell
Bought by
Renteria Fernandina and Renteria Alfredo
Home Financials for this Owner
Home Financials are based on the most recent Mortgage that was taken out on this home.
Original Mortgage
$138,295
Interest Rate
5.73%
Mortgage Type
FHA
Purchase Details
Closed on
Sep 7, 1993
Sold by
Huffman Joan Lee
Bought by
Musselman Russell and Musselman Clara L
Home Financials for this Owner
Home Financials are based on the most recent Mortgage that was taken out on this home.
Original Mortgage
$78,800
Interest Rate
6.88%
Create a Home Valuation Report for This Property
The Home Valuation Report is an in-depth analysis detailing your home's value as well as a comparison with similar homes in the area
Home Values in the Area
Average Home Value in this Area
Purchase History
| Date | Buyer | Sale Price | Title Company |
|---|---|---|---|
| Renteria Fernandina | -- | Financial Title Company | |
| Renteria Fernandina | $140,500 | First American Title Co | |
| Musselman Russell | $98,500 | Fidelity National Title |
Source: Public Records
Mortgage History
| Date | Status | Borrower | Loan Amount |
|---|---|---|---|
| Open | Renteria Fernandina | $140,800 | |
| Previous Owner | Renteria Fernandina | $138,295 | |
| Previous Owner | Musselman Russell | $78,800 |
Source: Public Records
Tax History
| Year | Tax Paid | Tax Assessment Tax Assessment Total Assessment is a certain percentage of the fair market value that is determined by local assessors to be the total taxable value of land and additions on the property. | Land | Improvement |
|---|---|---|---|---|
| 2025 | $2,129 | $202,774 | $50,692 | $152,082 |
| 2024 | $2,129 | $198,799 | $49,699 | $149,100 |
| 2023 | $2,074 | $194,902 | $48,725 | $146,177 |
| 2022 | $2,012 | $191,081 | $47,770 | $143,311 |
| 2021 | $1,984 | $187,334 | $46,833 | $140,501 |
| 2020 | $2,017 | $185,413 | $46,353 | $139,060 |
| 2019 | $2,066 | $181,777 | $45,444 | $136,333 |
| 2018 | $2,031 | $178,213 | $44,553 | $133,660 |
| 2017 | $2,011 | $174,718 | $43,679 | $131,039 |
| 2016 | $1,921 | $171,293 | $42,823 | $128,470 |
| 2015 | $1,854 | $168,720 | $42,180 | $126,540 |
| 2014 | $1,854 | $165,415 | $41,354 | $124,061 |
Source: Public Records
Map
Nearby Homes
- 855 E Pleasant Ave
- 648 Auburn St
- 320 N Blackstone St Unit 14
- 1072 E Sycamore Ave
- 1582 E Ben Franklin Ave
- 1142 N Gem St
- 1611 E Burton Ave
- 1128 N Jefferson St
- 861 E Sycamore Ave
- 1563 E Glenwood Ave
- 815 E Sycamore Ave
- 1741 Vineland Ave
- 149 S Salida Place
- 1205 Jamestown St
- 1113 N Manor Dr
- 1765 E Sandalwood Ave
- 1 Spruce St
- 1145 N M St
- 273 E Gannon Dr
- 908 N Beatrice Dr
- 1008 E Lyndale Ave
- 701 N Bonita Dr
- 1001 E Lyndale Ave
- 1009 E Lyndale Ave
- 649 N Bonita Dr
- 1017 E Lyndale Dr
- 956 E Lyndale Ave
- 1017 E Lyndale Ave
- 957 E Lyndale Dr
- 957 E Lyndale Ave
- 1020 E Lyndale Dr
- 948 E Lyndale Ave
- 620 N Bonita Dr
- 949 E Lyndale Dr
- 949 E Lyndale Ave
- 623 N Blackstone St
- 616 N Bonita Dr
- 617 N Bonita Dr
- 940 E Lyndale Ave
- 1012 Windsor Dr
Your Personal Tour Guide
Ask me questions while you tour the home.