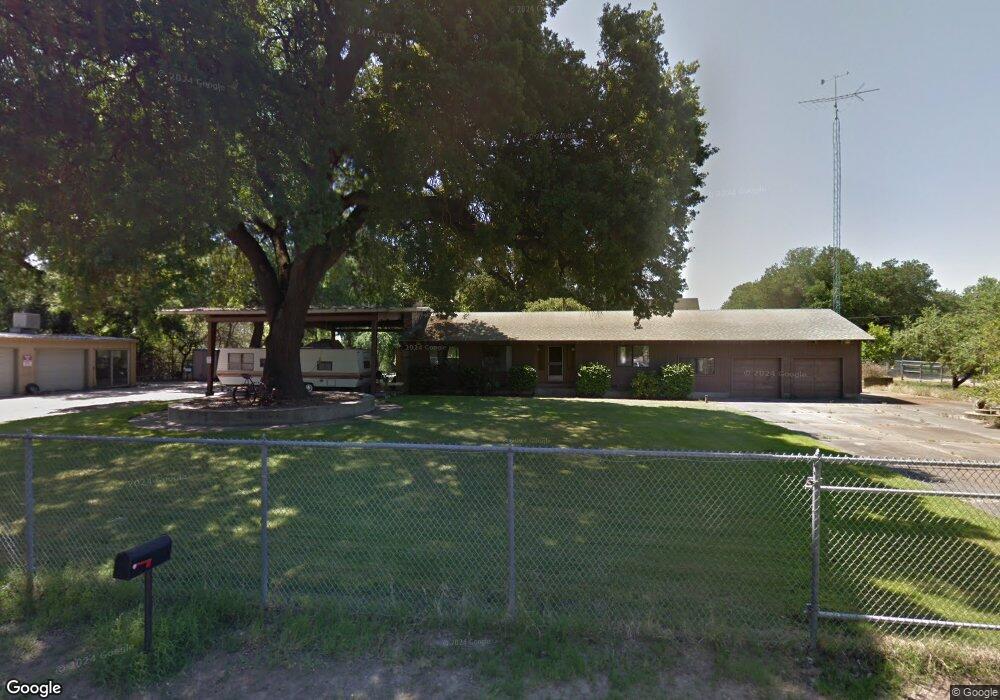
1000 Wetherbee Ave Manteca, CA 95337
Estimated Value: $537,000 - $659,000
1
Bed
2
Baths
1,404
Sq Ft
$422/Sq Ft
Est. Value
About This Home
This home is located at 1000 Wetherbee Ave, Manteca, CA 95337 and is currently estimated at $592,646, approximately $422 per square foot. 1000 Wetherbee Ave is a home located in San Joaquin County with nearby schools including Nile Garden Elementary School and Sierra High School.
Ownership History
Date
Name
Owned For
Owner Type
Purchase Details
Closed on
Apr 21, 2022
Sold by
Sbc Labor & Marketing Inc
Bought by
Elliott Derrol D and Elliott Edith G
Current Estimated Value
Purchase Details
Closed on
Jul 27, 2021
Sold by
Kelley Cecila M
Bought by
Sbc Labor & Marketing Inc
Home Financials for this Owner
Home Financials are based on the most recent Mortgage that was taken out on this home.
Original Mortgage
$300,000
Interest Rate
2.9%
Mortgage Type
Commercial
Purchase Details
Closed on
Feb 1, 2013
Sold by
Byrd Jim L and Byrd Sharen L
Bought by
Denchfield Raymond C and Kelley Cecilia M
Home Financials for this Owner
Home Financials are based on the most recent Mortgage that was taken out on this home.
Original Mortgage
$204,000
Interest Rate
3.29%
Mortgage Type
New Conventional
Create a Home Valuation Report for This Property
The Home Valuation Report is an in-depth analysis detailing your home's value as well as a comparison with similar homes in the area
Purchase History
| Date | Buyer | Sale Price | Title Company |
|---|---|---|---|
| Elliott Derrol D | $650,000 | Cypress Title | |
| Sbc Labor & Marketing Inc | $310,000 | Chicago Title Company | |
| Denchfield Raymond C | $255,000 | Chicago Title Company |
Source: Public Records
Mortgage History
| Date | Status | Borrower | Loan Amount |
|---|---|---|---|
| Previous Owner | Sbc Labor & Marketing Inc | $300,000 | |
| Previous Owner | Denchfield Raymond C | $204,000 |
Source: Public Records
Tax History
| Year | Tax Paid | Tax Assessment Tax Assessment Total Assessment is a certain percentage of the fair market value that is determined by local assessors to be the total taxable value of land and additions on the property. | Land | Improvement |
|---|---|---|---|---|
| 2025 | $7,314 | $638,900 | $190,000 | $448,900 |
| 2024 | $7,252 | $638,900 | $190,000 | $448,900 |
| 2023 | $7,573 | $663,000 | $198,900 | $464,100 |
| 2022 | $3,675 | $310,000 | $90,000 | $220,000 |
| 2021 | $3,653 | $312,301 | $136,515 | $175,786 |
| 2020 | $3,512 | $309,100 | $135,116 | $173,984 |
| 2019 | $3,468 | $303,040 | $132,467 | $170,573 |
| 2018 | $3,423 | $297,099 | $129,870 | $167,229 |
| 2017 | $3,374 | $291,274 | $127,324 | $163,950 |
| 2016 | $3,296 | $285,564 | $124,828 | $160,736 |
| 2014 | $2,822 | $256,158 | $120,545 | $135,613 |
Source: Public Records
Map
Nearby Homes
- 1355 Williamson Rd
- 1365 Williamson Rd
- 4399 Aplicella Ct Unit 75
- 4399 Aplicella Ct Unit 59
- 4399 Aplicella Ct Unit 67
- 4399 Aplicella Ct Unit 32
- 1390 Williamson Rd
- 4129 Castellina Way
- 1739 Tornillo Ave
- 1717 Tornillo Ave
- 1732 Tornillo Ave
- 1718 Tornillo Ave
- 3266 Leo David St
- 3242 Leo David St
- 3548 Rapallo Way
- 3271 Nightfall Dr
- 1729 Felbrigg Dr
- 1721 Felbrigg Dr
- 1140 Duomo Way
- 1718 Felbrigg Dr
- 951 Wetherbee Ave
- 20484 Ash Ln
- 991 Wetherbee Ave
- 20525 Ash Ln
- 975 Williamson Rd
- 999 Wetherbee Ave
- 949 Williamson Rd
- 950 E Willow Ave
- 950 E Willow St
- 974 E Willow Ave
- 1007 Wetherbee Ave
- 20475 Ash Ln
- 20475 Ash Ln
- 990 E Willow Ave
- 893 Wetherbee Ave
- 900 Wetherbee Ave
- 896 E Willow St
- 1006 E Willow Ave
- 1015 Wetherbee Ave
- 969 E Willow Ave
Your Personal Tour Guide
Ask me questions while you tour the home.