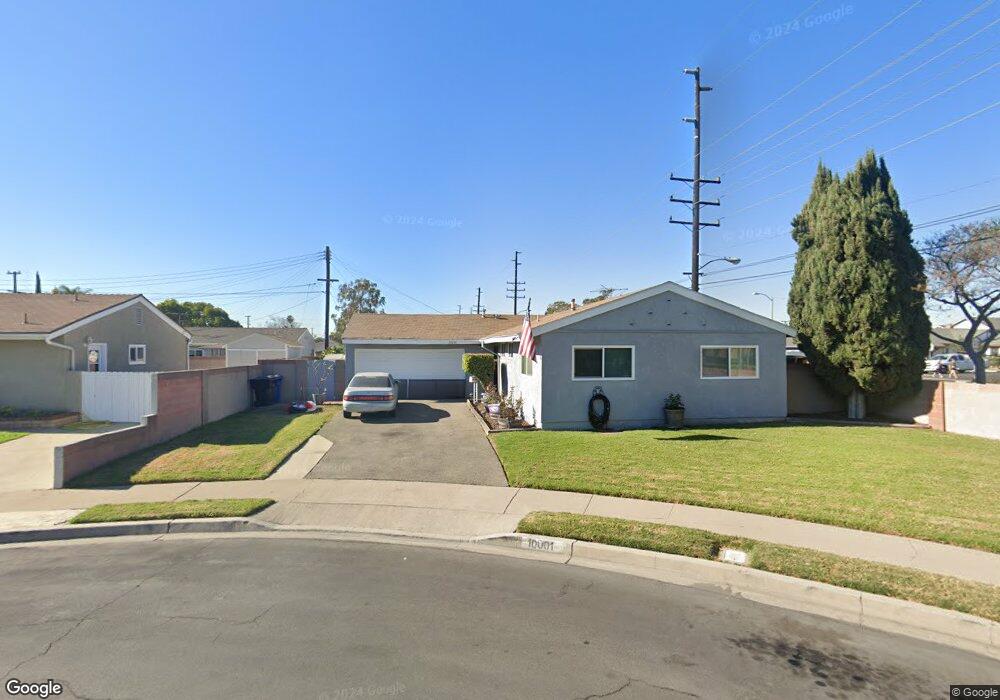
10001 Saint Elizabeth Cir Cypress, CA 90630
Estimated Value: $863,067 - $977,000
3
Beds
2
Baths
1,049
Sq Ft
$881/Sq Ft
Est. Value
About This Home
This home is located at 10001 Saint Elizabeth Cir, Cypress, CA 90630 and is currently estimated at $923,767, approximately $880 per square foot. 10001 Saint Elizabeth Cir is a home located in Orange County with nearby schools including Juliet Morris Elementary School, Lexington Junior High School, and Cypress High School.
Ownership History
Date
Name
Owned For
Owner Type
Purchase Details
Closed on
Nov 17, 2021
Sold by
Graham Karen L and Karen Graham Living Trust
Bought by
Kl Graham Properties Llc
Current Estimated Value
Purchase Details
Closed on
Feb 10, 2021
Sold by
Graham Karen L and Karen Graham Living Trust
Bought by
Graham Curtis B and Graham Investment Trust
Purchase Details
Closed on
Oct 23, 2018
Sold by
Graham Karen L
Bought by
Graham Karen L and Karen Graham Living Trust
Purchase Details
Closed on
Sep 10, 2014
Sold by
Graham Bleeker L and Graham Philip D
Bought by
Graham Bleeker L and Graham Family Trust
Purchase Details
Closed on
Dec 7, 2012
Sold by
Graham Bleeker L
Bought by
Graham Bleeker L and Graham Family Bypass Trust
Purchase Details
Closed on
Nov 9, 2011
Sold by
Graham Bleeker L
Bought by
Graham Bleeker L and Graham Family Survivors Trust
Purchase Details
Closed on
Mar 26, 1992
Sold by
Graham B L B and Graham Juanita L
Bought by
Graham Bleeker L and Graham Juanita L
Create a Home Valuation Report for This Property
The Home Valuation Report is an in-depth analysis detailing your home's value as well as a comparison with similar homes in the area
Home Values in the Area
Average Home Value in this Area
Purchase History
| Date | Buyer | Sale Price | Title Company |
|---|---|---|---|
| Kl Graham Properties Llc | -- | None Available | |
| Graham Curtis B | -- | None Available | |
| Graham Karen L | -- | None Available | |
| Graham Bleeker L | -- | None Available | |
| Graham Bleeker L | -- | None Available | |
| Graham Bleeker L | -- | None Available | |
| Graham Bleeker L | -- | -- |
Source: Public Records
Tax History Compared to Growth
Tax History
| Year | Tax Paid | Tax Assessment Tax Assessment Total Assessment is a certain percentage of the fair market value that is determined by local assessors to be the total taxable value of land and additions on the property. | Land | Improvement |
|---|---|---|---|---|
| 2025 | $1,025 | $59,490 | $28,529 | $30,961 |
| 2024 | $1,025 | $58,324 | $27,970 | $30,354 |
| 2023 | $998 | $57,181 | $27,422 | $29,759 |
| 2022 | $980 | $56,060 | $26,884 | $29,176 |
| 2021 | $968 | $54,961 | $26,357 | $28,604 |
| 2020 | $962 | $54,398 | $26,087 | $28,311 |
| 2019 | $944 | $53,332 | $25,576 | $27,756 |
| 2018 | $932 | $52,287 | $25,075 | $27,212 |
| 2017 | $906 | $51,262 | $24,583 | $26,679 |
| 2016 | $898 | $50,257 | $24,101 | $26,156 |
| 2015 | $889 | $49,503 | $23,739 | $25,764 |
| 2014 | $851 | $48,534 | $23,274 | $25,260 |
Source: Public Records
Map
Nearby Homes
- 5411 Marion Ave
- 5472 Marion Ave
- 5041 Myra Ave
- 5511 Kanel Cir
- 9678 Walker Ct
- 10362 Aurelia Ave
- 5763 Laguna Way Unit 49
- 5841 Laguna Way Unit 62
- 9565 Graham St
- 9866 Lido Way Unit 20
- 4777 Larwin Ave
- 9011 Cerise Ln Unit 121
- 9011 Cerise Ln
- 9011 Cerise Ln Unit 122
- Plan B1X at Citrus Square - Cerise
- Plan B1 at Citrus Square - Cerise
- Plan A1 at Citrus Square - Cerise
- Plan A2 at Citrus Square - Cerise
- 9001 Cerise Ln Unit 109
- 9001 Cerise Ln Unit 113
- 10011 Saint Elizabeth Cir
- 10002 Saint George Cir
- 10012 Saint George Cir
- 10021 Saint Elizabeth Cir
- 9998 Barcelona Ln
- 10022 Saint George Cir
- 10012 Saint Elizabeth Cir
- 10022 Saint Elizabeth Cir
- 5401 Belle Ave
- 9997 Barcelona Ln
- 5391 Belle Ave
- 9980 Barcelona Ln
- 5381 Belle Ave
- 10001 Saint Agnes Cir
- 10001 Saint George Cir
- 5431 Belle Ave
- 10011 Saint Agnes Cir
- 10011 Saint George Cir
- 9983 Barcelona Ln
- 10021 Saint George Cir