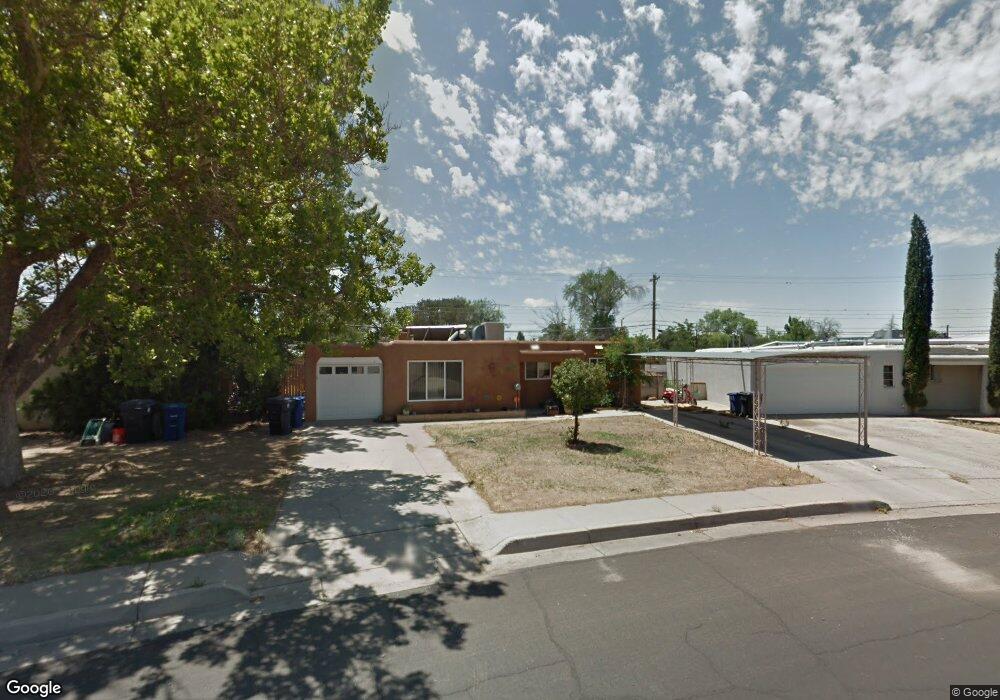
10004 Propps St NE Albuquerque, NM 87112
Northeast Heights NeighborhoodEstimated Value: $271,000 - $330,000
3
Beds
1
Bath
1,713
Sq Ft
$178/Sq Ft
Est. Value
About This Home
This home is located at 10004 Propps St NE, Albuquerque, NM 87112 and is currently estimated at $304,102, approximately $177 per square foot. 10004 Propps St NE is a home located in Bernalillo County with nearby schools including Eldorado High School, Matheson Park Elementary School, and Hoover Middle School.
Ownership History
Date
Name
Owned For
Owner Type
Purchase Details
Closed on
Jul 8, 2021
Sold by
Higgins Jessica
Bought by
Marquez Raymond R
Current Estimated Value
Home Financials for this Owner
Home Financials are based on the most recent Mortgage that was taken out on this home.
Original Mortgage
$172,175
Outstanding Balance
$155,883
Interest Rate
2.9%
Mortgage Type
New Conventional
Estimated Equity
$148,219
Purchase Details
Closed on
Nov 24, 2003
Sold by
Hindman Boyd R and Hindman Leesa M
Bought by
Higgins Jessica
Home Financials for this Owner
Home Financials are based on the most recent Mortgage that was taken out on this home.
Original Mortgage
$129,000
Interest Rate
5.93%
Mortgage Type
Purchase Money Mortgage
Purchase Details
Closed on
Jan 29, 1998
Sold by
Warner Herbert D and Warner Theresa
Bought by
Hindman Boyd R and Hindman Leesa M
Create a Home Valuation Report for This Property
The Home Valuation Report is an in-depth analysis detailing your home's value as well as a comparison with similar homes in the area
Home Values in the Area
Average Home Value in this Area
Purchase History
| Date | Buyer | Sale Price | Title Company |
|---|---|---|---|
| Marquez Raymond R | -- | Stewart Title | |
| Higgins Jessica | -- | Fidelity National Title Co | |
| Hindman Boyd R | -- | First American Title |
Source: Public Records
Mortgage History
| Date | Status | Borrower | Loan Amount |
|---|---|---|---|
| Open | Marquez Raymond R | $172,175 | |
| Previous Owner | Higgins Jessica | $129,000 |
Source: Public Records
Tax History Compared to Growth
Tax History
| Year | Tax Paid | Tax Assessment Tax Assessment Total Assessment is a certain percentage of the fair market value that is determined by local assessors to be the total taxable value of land and additions on the property. | Land | Improvement |
|---|---|---|---|---|
| 2025 | $2,832 | $71,202 | $14,386 | $56,816 |
| 2024 | $2,832 | $69,128 | $13,967 | $55,161 |
| 2023 | $2,783 | $67,115 | $13,560 | $53,555 |
| 2022 | $2,686 | $65,160 | $13,165 | $51,995 |
| 2021 | $2,266 | $55,516 | $15,719 | $39,797 |
| 2020 | $2,226 | $53,899 | $15,261 | $38,638 |
| 2019 | $2,158 | $52,330 | $14,817 | $37,513 |
| 2018 | $2,079 | $52,330 | $14,817 | $37,513 |
| 2017 | $2,013 | $50,806 | $14,386 | $36,420 |
| 2016 | $1,952 | $47,890 | $13,560 | $34,330 |
| 2015 | $46,495 | $46,495 | $13,165 | $33,330 |
| 2014 | $1,899 | $46,715 | $11,689 | $35,026 |
| 2013 | -- | $45,355 | $11,349 | $34,006 |
Source: Public Records
Map
Nearby Homes
- 2329 Britt St NE
- 2417 Britt St NE
- 10410 Towner Ave NE
- 2700 Eubank Blvd NE
- 2805 Christine St NE
- 9521 Salem Rd NE
- 3110 Betts Dr NE
- 10708 Lexington Ave NE
- 2905 Dorothy St NE
- 2904 June St NE
- 1812 Mary Ellen St NE
- 1800 Pitt St NE
- 9521 Snow Heights Blvd NE
- 9616 Morrow Ave NE
- 9916 Toltec Rd NE
- 1801 June St NE
- 1724 Glorieta St NE
- 11008 Morris Ct NE
- 9716 Indian School Rd NE
- 32 Lakeshore Dr NE
- 10000 Propps St NE
- 2311 Stevens Dr NE
- 2305 Stevens Dr NE
- 9916 Salem Rd NE
- 10012 Propps St NE
- 10005 Propps St NE
- 2315 Stevens Dr NE
- 9921 Leyendecker Rd NE
- 9917 Salem Rd NE
- 10011 Propps St NE
- 9917 Leyendecker Rd NE
- 9912 Salem Rd NE
- 2319 Stevens Dr NE
- 10016 Propps St NE
- 9913 Salem Rd NE
- 10015 Propps St NE
- 9908 Salem Rd NE
- 10020 Propps St NE
- 2312 Stevens Dr NE
- 2300 Stevens Dr NE