1001 Hayes St Fairfield, CA 94533
Estimated Value: $332,000 - $457,000
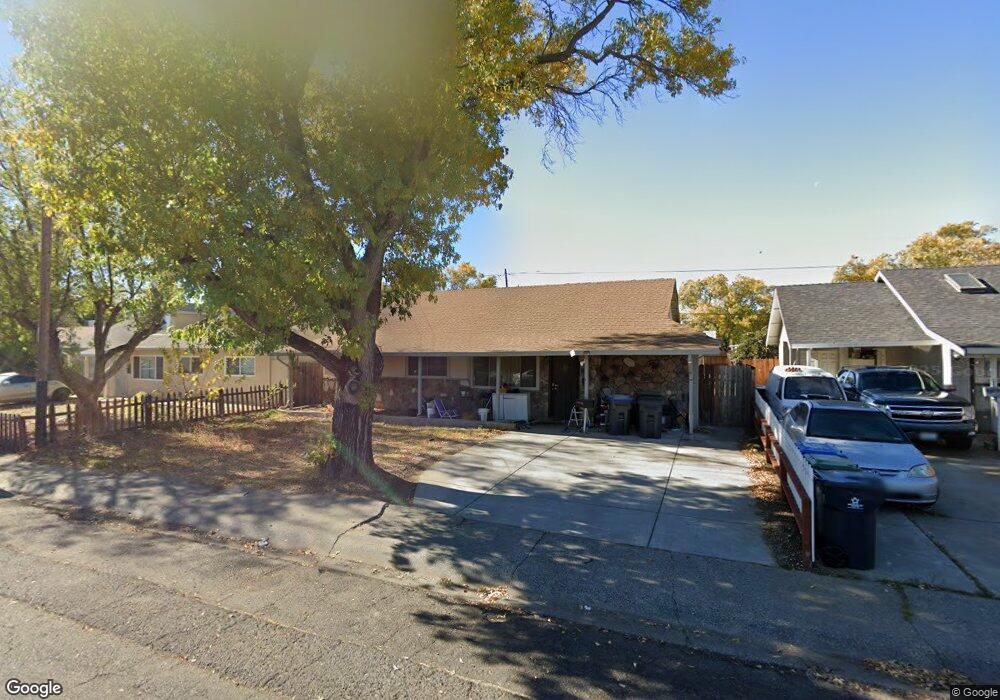
About This Home
This home is located at 1001 Hayes St, Fairfield, CA 94533 and is currently estimated at $422,975, approximately $346 per square foot. 1001 Hayes St is a home located in Solano County with nearby schools including Fairview Elementary School, Crystal Middle School, and Armijo High School.
Ownership History
We collect this data history from publicly available records. To have your information removed, we recommend requesting removal directly through your county’s website.
Purchase Details
Home Financials for this Owner
Home Financials are based on the most recent Mortgage that was taken out on this home.Purchase Details
Home Financials for this Owner
Home Financials are based on the most recent Mortgage that was taken out on this home.Purchase Details
Home Financials for this Owner
Home Financials are based on the most recent Mortgage that was taken out on this home.Home Values in the Area
Average Home Value in this Area
Purchase History
We collect this data history from publicly available records. To have your information removed, we recommend requesting removal directly through your county’s website.
| Date | Buyer | Sale Price | Title Company |
|---|---|---|---|
| $223,000 | Chicago Title Company | ||
| $125,000 | Placer Title Company | ||
| $112,500 | Placer Title Company |
Mortgage History
We collect this data history from publicly available records. To have your information removed, we recommend requesting removal directly through your county’s website.
| Date | Status | Borrower | Loan Amount |
|---|---|---|---|
| Open | $150,000 | ||
| Previous Owner | $125,000 | ||
| Previous Owner | $114,391 |
Tax History
We collect this data history from publicly available records. To have your information removed, we recommend requesting removal directly through your county’s website.
| Year | Tax Paid | Tax Assessment Tax Assessment Total Assessment is a certain percentage of the fair market value that is determined by local assessors to be the total taxable value of land and additions on the property. | Land | Improvement |
|---|---|---|---|---|
| 2025 | $2,988 | $273,355 | $61,287 | $212,068 |
| 2024 | $2,988 | $267,996 | $60,086 | $207,910 |
| 2023 | $2,895 | $262,742 | $58,908 | $203,834 |
| 2022 | $2,858 | $257,591 | $57,754 | $199,837 |
| 2021 | $2,829 | $252,541 | $56,622 | $195,919 |
| 2020 | $2,762 | $249,953 | $56,042 | $193,911 |
| 2019 | $2,693 | $245,053 | $54,944 | $190,109 |
| 2018 | $2,778 | $240,249 | $53,867 | $186,382 |
| 2017 | $2,648 | $235,539 | $52,811 | $182,728 |
| 2016 | $2,623 | $230,922 | $51,776 | $179,146 |
| 2015 | $2,448 | $227,455 | $50,999 | $176,456 |
| 2014 | $2,161 | $192,318 | $49,169 | $143,149 |
Map
- 1042 Hayes St
- 1019 Buchanan St
- 1443 Minnesota St
- 1712 Utah St
- 1542 Minnesota St
- 1722 Indiana St
- 913 5th St
- 1201 Missouri St
- 423 Gregory Ln Unit 28L
- 1517 Garfield St
- 0 Madison St
- 0 Webster St Unit 41120649
- 1500 Harrison St
- 712 Maryland St
- 1500 Monroe St
- 213 Stephen St
- 1220 Illinois St
- 1930 Vine Dr
- 1607 James St
- 945 Ohio St
Ask me questions while you tour the home.